
Slideshow:
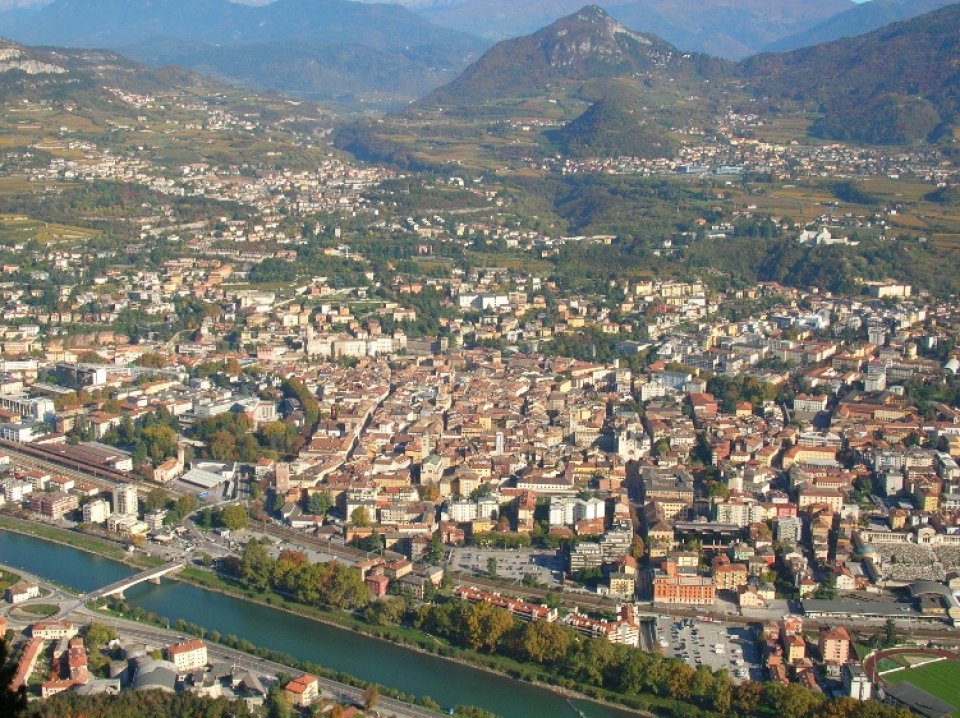
Trento is an alpine city of 120,000 inhabitants in north-eastern Italy. The main settlement is located along the Adige River’s valley floor, and hosts around 70% of the city’s population. The remaining 30% lives in small villages spread in the surrounding hills. One of the main objectives of the administration in the last years has been to increase the amount of public green areas, particularly in deprived neighbourhoods, so as to improve equity in distribution and access. Recently, most of the efforts have focused on peri-urban areas, by creating new parks and launching activities aimed at improving the daily practices of green space management through citizens’ involvement in co-designing and co-development of new functions and uses.
The drafting of the new Urban Plan for the city of Trento, which initiated in 2017 and it is still on-going, provided the opportunity to revise and update the strategies regarding urban green infrastructures, to coordinate ongoing initiatives, and to perform an urban ecosystem service assessment. The overall purpose of the assessment has been to enhance the provision of ecosystem services, and related benefits, through the actions and instruments of the Urban Plan. Specific policy questions related to the potential uses of ecosystem service knowledge to support the planning process are the following:
- How can ecosystem service knowledge improve the identification of the structural elements of the Urban Plan?
- How can ecosystem service assessment support the comparison of specific planning options?
The En-Route City Lab, which involves both researchers and city officers, benefitted, since its establishment, from several other initiatives that created synergies on the topic of green infrastructures and urban ecosystem services. Particularly, the City was involved in an Alpine Space project on green infrastructures in peri-urban areas (Los_Dama!) and was starting the activities for the drawing of the new Urban Plan. Researchers of the University had just contributed to the MAES Urban Pilot (with a study in the city of Trento) and were involved in the ESMERALDA project on ecosystem services mapping and assessment. This allowed to magnify the message of the City Lab, creating collaborations beyond the people directly involved in En-Route. For example, a specific process of expert consultation was designed for the assessment of nature-based recreation. Seventeen experts, including officers from several municipal and provincial departments, researchers from various institutions, and local practitioners, were involved through an on-line questionnaire, and a follow-up discussion. In general, the urban ecosystem service assessment (described in Sections 5 and 6) was carried out in close collaboration with key staff from city administration, who contributed to the definition of the policy questions and the selection of ecosystem services, and provided feedback on the results.
Among the milestones of this policy-science interface process were:
- Interaction between researchers and city officers to understand each other’s perspective on green infrastructures data availability and data needs;
- Meetings between researchers and city officers to present preliminary results of the ecosystem service assessment;
- Formal involvement of researchers from the University of Trento in the urban planning process
- Workshop of the ESMERALDA project, held in Trento, which featured a discussion on the Trento case study with participation from several officers from the administration and international policy-makers, as well as researchers specialized in ecosystem services.
The first policy question has been answered by identifying ecosystem service hotspots to be included as strategic structural elements in the Urban Plan. Six relevant ecosystem services/themes have been selected. Mapping methods include a variety of approaches, ranging from the use of proxies based on available data to the application of models.
Table 1: Indicators and definitions applied to identify ecosystem service hotspots in Trento.
|
ECOSYSTEM SERVICE / THEME |
INDICATOR |
HOTSPOT DEFINED AS: |
|
habitat for biodiversity |
species richness and relative abundance (Tattoni et al., 2013) |
biodiversity hotspots (areas larger than 200 ha with high relative abundance) + areas characterized by medium, high, or very high richness of focal species |
|
level of protection |
protected areas at various levels (Natura 2000 sites, local reserves, etc.) |
|
|
risk mitigation (rock falls, landslides, floods) |
protective function of forests |
forests characterized by potential protective function + |
|
level of geological hazard |
areas characterized by high level of geological hazard |
|
|
flood zone |
permeable (non-urban) areas in high-hazard flood zones |
|
|
air purification and noise reduction |
proximity to high traffic roads and railways (for noise) |
woody areas close to residential settlements located within a maximum distance from main transport infrastructure |
|
landscape value (esthetic appreciation and identity) |
class of landscape value based on forest types and location |
areas classified as of high landscape value |
|
food production |
agricultural value based on land price (acquisition for public uses) and morphological suitability – the value of the indicator ranges from 2 to 8 |
agricultural value ≥ 6 |
|
cooling |
cooling capacity class (Zardo et al. 2017) |
areas in class A+, A or B of cooling capacity |
The answer to the second policy question is still a work-in-progress. A testing application has been carried out by assessing and comparing planning alternatives that consider the hypothetical conversion of brownfields into new urban parks. Indicators of two key ecosystem services for the city, i.e. cooling (microclimate regulation) and nature-based recreation, have been used to quantify potential beneficiaries of the interventions, and comparing the alternatives.
Table 2: Indicators used for the testing application to the assessment of specific planning options.
|
ECOSYSTEM SERVICE |
INDICATOR |
METHOD |
|
cooling |
class of cooling effect |
Described in Zardo et al. 2017 |
|
number of people affected by the planning scenario (change in class of cooling effect) broken down into different vulnerable groups |
Described in Cortinovis and Geneletti, 2018 |
|
|
nature-based recreation |
class of Recreation Opportunity Spectrum |
Described in Cortinovis et al., 2018 |
|
number of people affected by the planning scenario (increased availability of near-by recreational areas) broken down into different vulnerable groups |
Described in Cortinovis and Geneletti, 2018 |
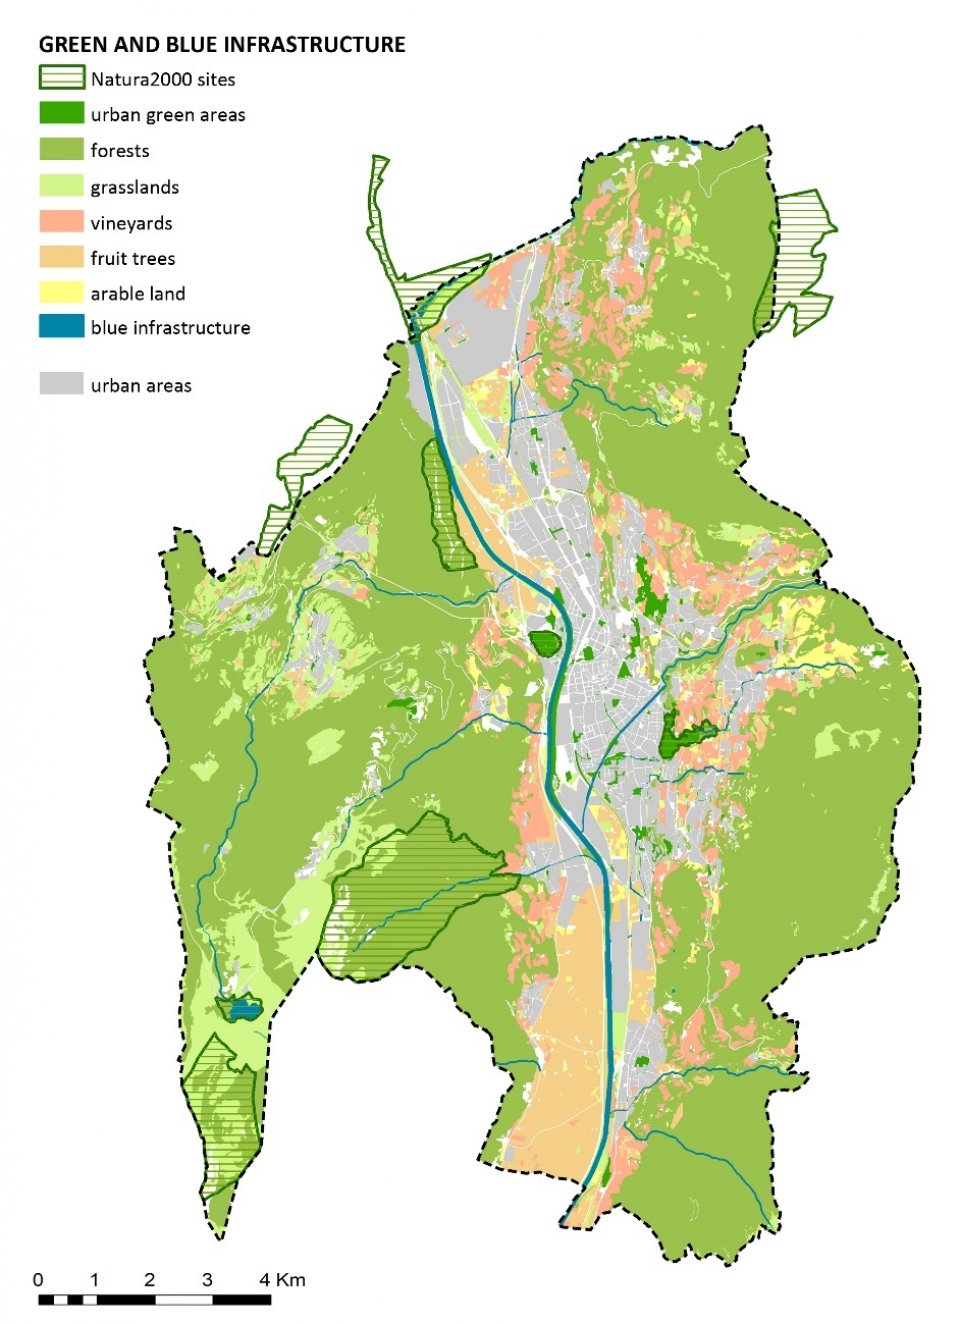
Map 1: green and blue infrastructure in Trento

In Trento, urban and peri-urban green areas account for 210 ha, 157 of which are usable green spaces (13.4 m2/inhabitant), and forests cover around 1/3 of the municipal territory. This determines a generally high proximity of urban areas to natural environments. More than 10 km2 of the city administrative area is designated as natural protected area, including seven Natura 2000 sites and three local reserves. The city also includes the largest total agricultural area among all municipalities of the province. The main cultivations are vineyards and apple orchards, which occupy sectors of the hills and the few non-urbanized patches in the valley floor (see Map 1).
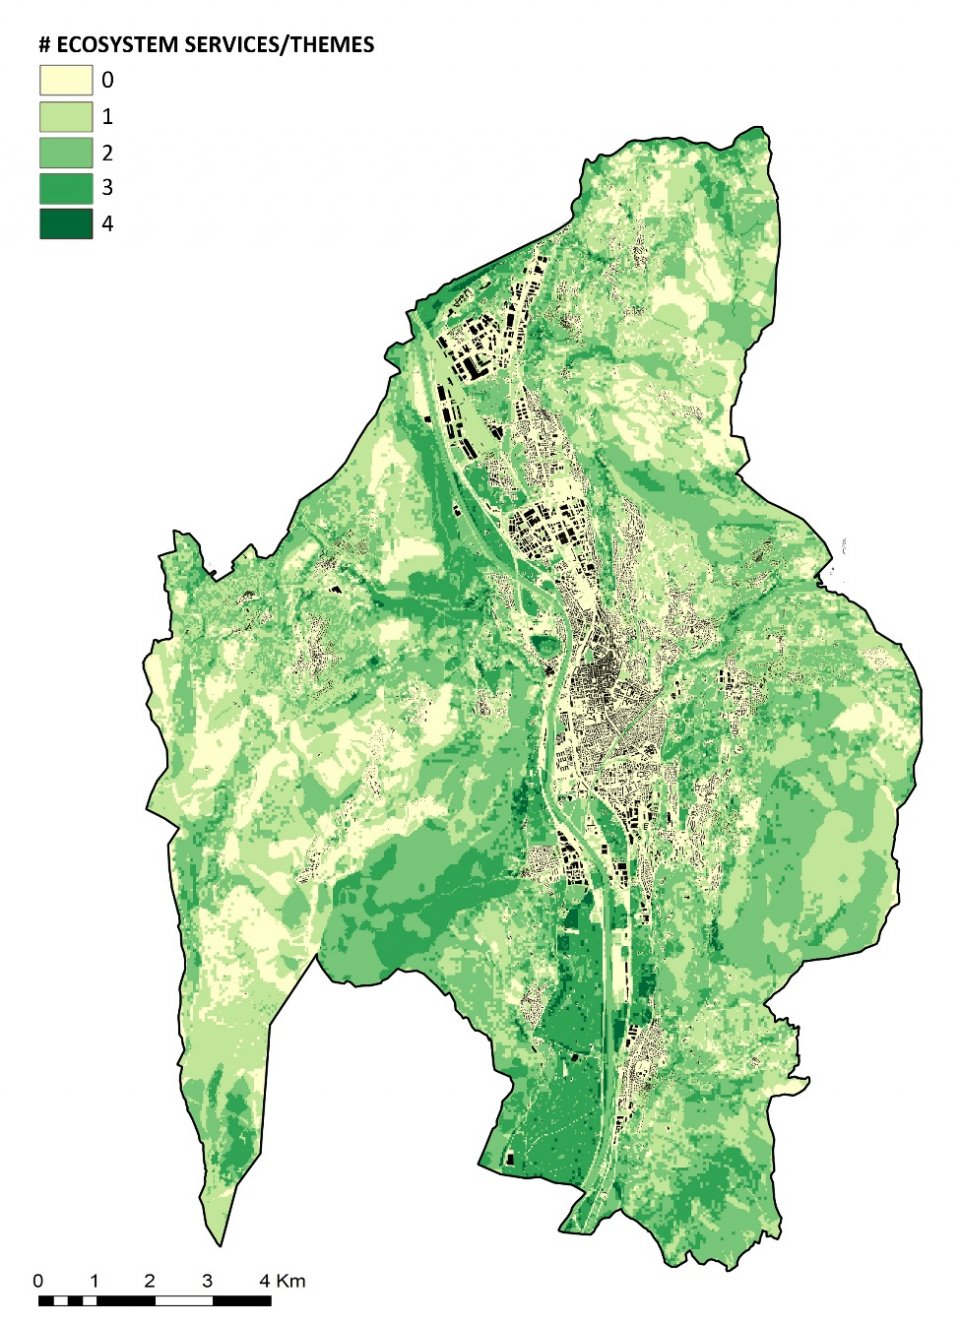
Map 2: Ecosystem service hotspots in the city of Trento resulting from the overlay of six thematic maps.

Map 2 is the result of the overlay of six thematic maps (Table 1) and shows the ecosystem service hotspots in the city of Trento. Values in the map range between zero and four, because there are no locations that are classified as hotspots for more than four ecosystem services. The hotspots can be found not only among forests and natural areas surrounding the city, but also in the intensely-urbanised valley floor. They are represented by agricultural patches and green wedges, which are often relevant for more than one ecosystem service and characterised by a high biodiversity value. Currently, unlike forests and natural areas that benefit from some levels of protection, the importance of these hotspots is not acknowledged. In the strategic map of the future Urban Plan, all areas classified as hotspot should be designated as structural elements. This designation will guarantee their protection against urbanisation and implies their inclusion as key elements in the design of the urban green infrastructure of the city.
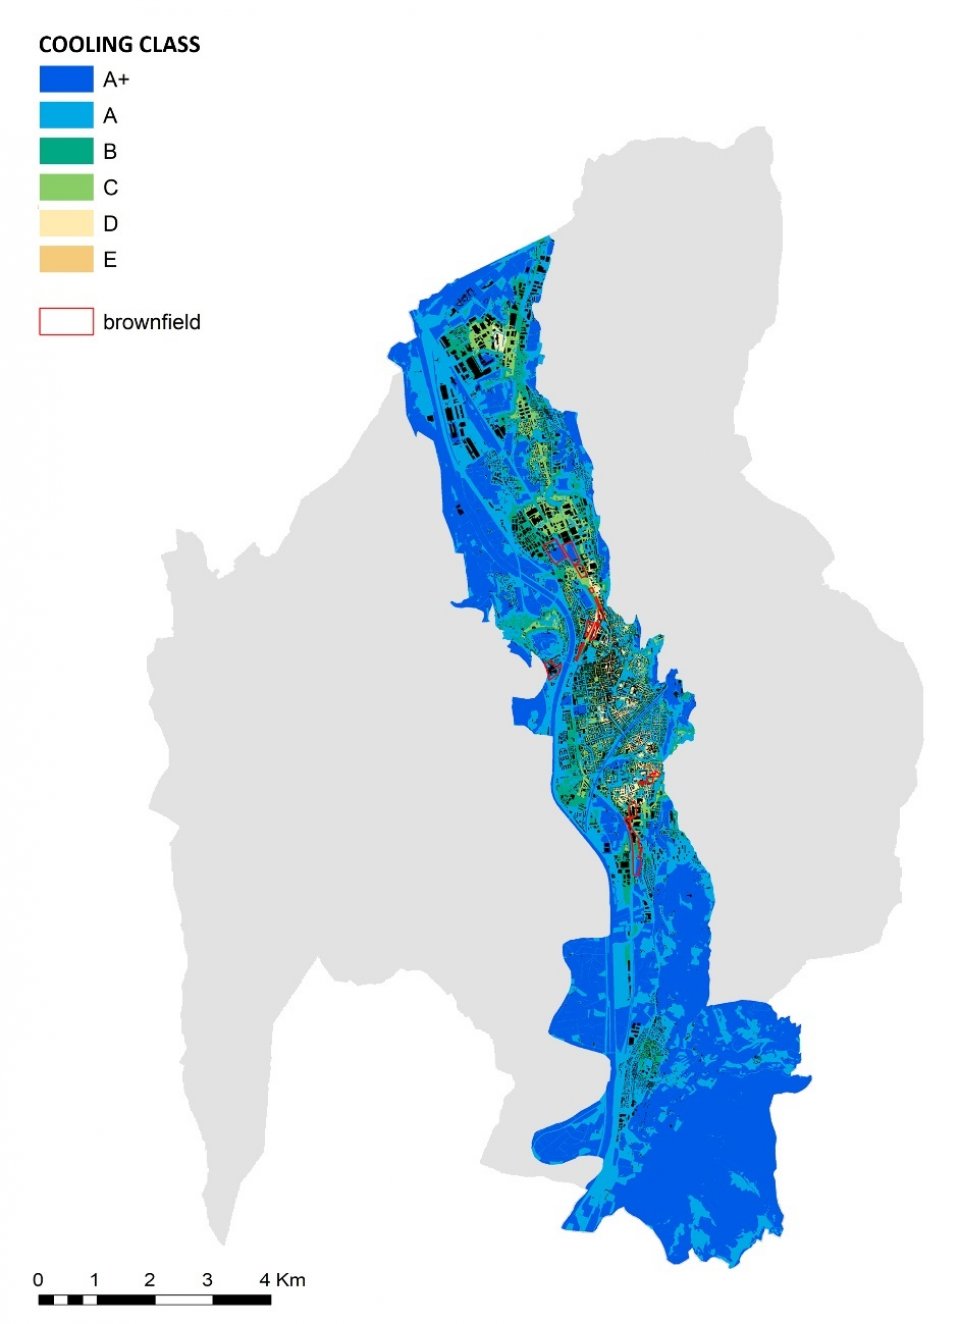
Map 3: cooling effect produced by green infrastructure.

Map 3 shows the cooling effect produced by green infrastructure in the most urbanized area of the city of Trento, i.e. the valley floor. The highest classes of cooling effect prevail, due to the presence of close-by forests and of the River Adige and its tributaries that contribute to mitigate the negative effects of the urban heat island and to lower the temperature during summer heat waves. The most disadvantaged areas are in the dense neighborhoods close to the city center and in the northern suburbs, where the scarcity of green infrastructure and the high rate of soil sealing.
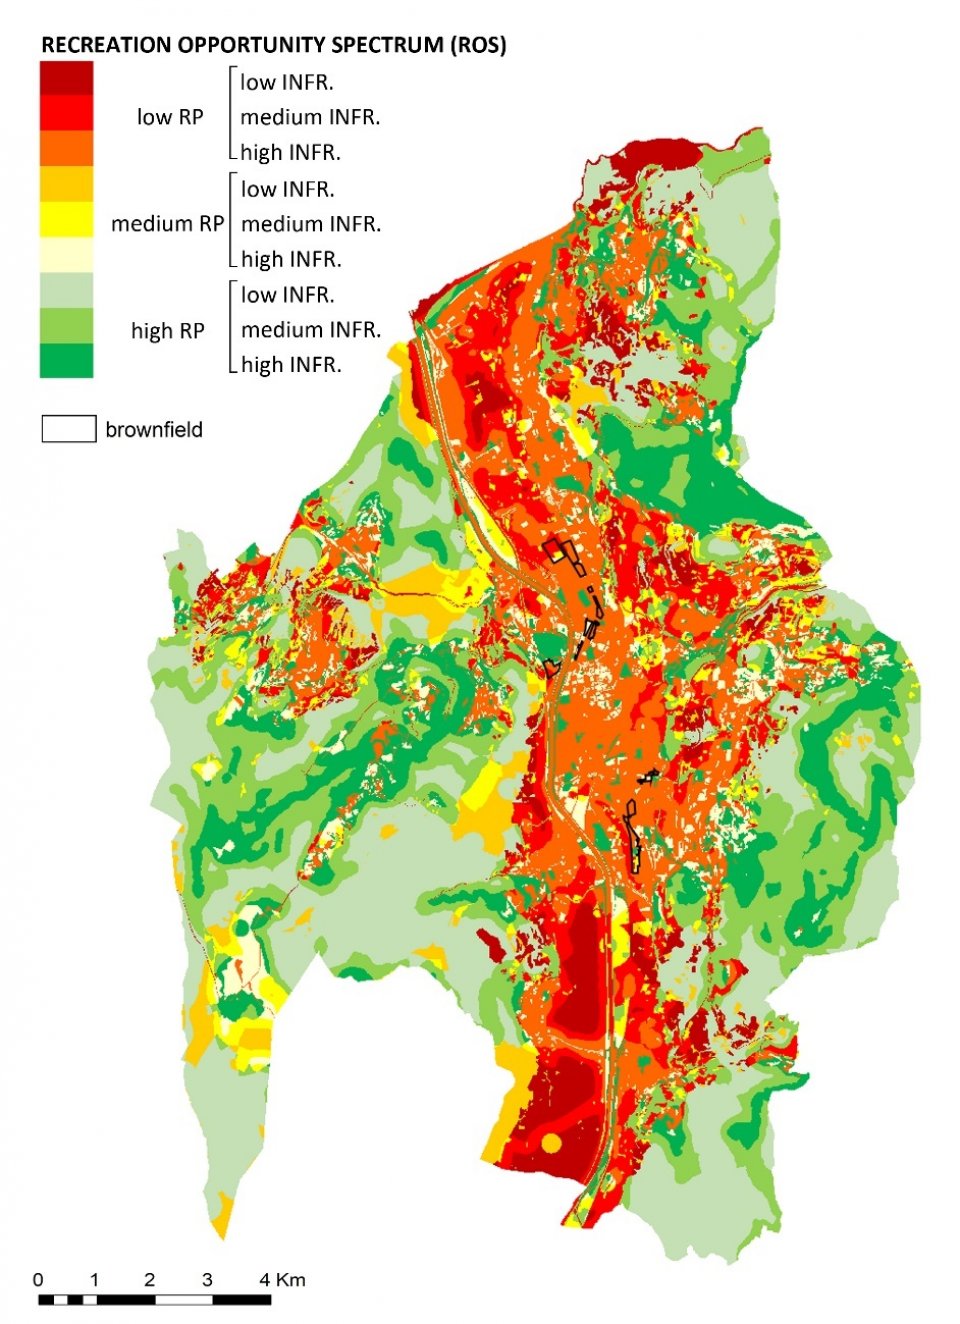
Map 4: Recreation Opportunity Spectrum (ROS)

Map 4 shows the Recreation Opportunity Spectrum (ROS) in the city of Trento. The indicator is obtained from a cross-tabulation between the Recreation Potential, which depends on the intrinsic natural features of the areas, and the availability of infrastructures and facilities that make it possible to use green areas for recreational purposes. The valley floor is mostly characterized by low potential, but high availability of infrastructures and facilities, which makes the existing green areas (urban parks and river banks) highly accessible and usable. Outside the urban area, many forests fall in the highest class of the opportunity spectrum, due to the high density of hiking trails and facilities dedicated to sport activities.
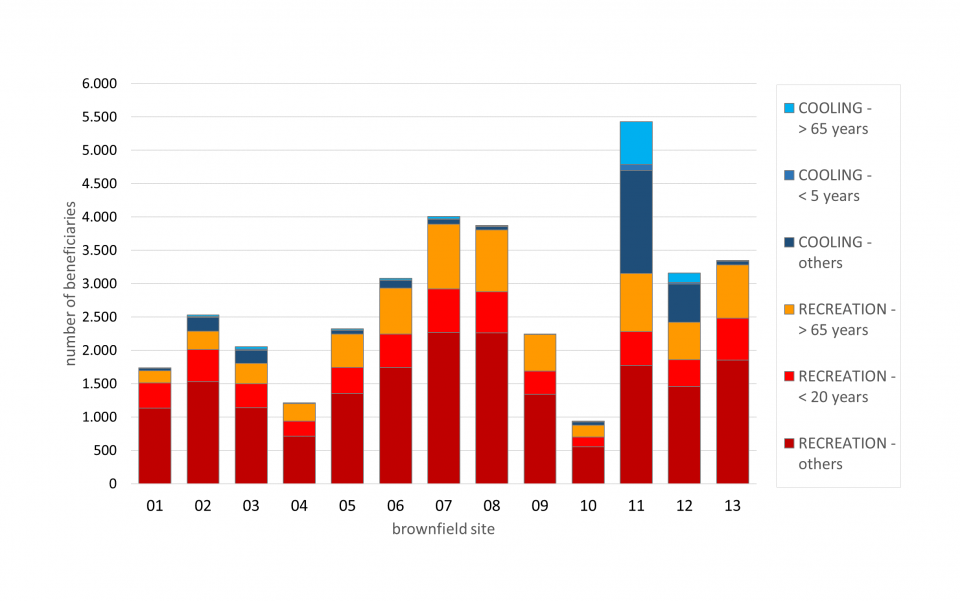
Figure 1: Comparison of brownfield regeneration scenarios based on the number of beneficiaries of two selected urban ecosystem services, i.e. cooling and nature-based recreation, broken down into different age-related vulnerability classes.

The graph compares the number of beneficiaries produced by the hypothetical conversion of existing brownfields into new urban parks. The total value is the sum of the beneficiaries of two ecosystem services (cooling and nature-based recreation), which have been broken down into different vulnerable groups according to age structure.
In terms of policy relevance, the ecosystem service hotspots, i.e., areas instrumental to ensure high level of provision of ecosystem services, are becoming part of the “structural elements” of the Urban Plan currently being drafted, along with more traditionally recognised elements, such as protected areas or areas subject to hydrological risk. The inclusion of ecosystem service hotspots among the structural elements of the Urban Plan ensures that urban green and blue infrastructures are considered as a primary component of the urban system during the design of the Plan. The hotspots will be preserved from urbanization and different actions are under consideration to improve the current network of green and blue spaces, thus increasing both connectivity and the provision of ecosystem services.
In the future, more detailed urban ecosystem services assessments that consider also the demand for ecosystem services by citizens (leading to the identification, for example, of disadvantaged neighbourhoods, and to the suggestions of different types of interventions suitable to satisfy current and future demand) might have an impact on some of decisions that the Urban Plan will have to take. An illustrative application of the potential policy relevance has been described in Section 5, and concerns the comparison of different greening interventions in brownfield sites. Similar analyses can be used by the Urban Plan to define of specific requirements (e.g., in terms of ecosystem services provision) for future urban transformations.
More generally, the work conducted under EnRoute, in synergy with other initiatives that involved directly or indirectly the city of Trento (MAES Urban Pilot; ESMERALDA Horizon 2020 Coordination and Support Action), made the topic of ecosystem services more visible and prominent within the administration, and the officers involved in green area management and urban planning. These initiatives provided a clear contribution to the emergence of ecosystem services in the policy agenda.
The EnRoute city lab created an opportunity to enhance the collaboration among different institutions on topics relevant to the planning and management of green and blue space in the city. As illustrated, in Section 4, a tangible element of this collaboration is the working group that was establish to contribute to the assessment of the recreation potential of green and blue space. The main lesson that can be learnt is that the so-called “science-policy interfaces” are processes, rather than individual events or projects. An event or project can establish them (or believe to have establish them…) but their functioning requires long-term interactions, and occur through phases that are not necessary straightforward, and sometimes unpredictable.
The test application that was conducted to show how the analysis of ecosystem services supply can be combined with the analysis of the demand (by different groups of beneficiaries) to compare planning options can provide inspiration to develop innovative approaches to urban planning, as well as green area management. However, further work is needed, both in terms of mapping and assessing ecosystem services and in terms of interacting with planning regulations and practice, to understand how the outcomes can be directly integrated into specific planning decisions.
Further information
• Ecosystem service hotspots have been identified by combining maps with different resolution. This was due to different indicators and methods used to quantify ecosystem services, but also to the different themes and ecosystem services that have been considered. Hence, the spatial scale of the final output is constrained by the information with the lowest resolution;
• Existing maps and data collected for other purposes by the city administration have been used as proxies of ecosystem services. While this approach may be less reliable than more complex modeling approaches, a positive aspect is that it uses data already validated. On the contrary, models such as those for the assessment of the cooling effect and of nature-based recreation could not be validated with observed data (yet);
• The ecosystem service mapping and assessment exercise produced outputs that are suitable for the first policy question (concerning the identification of the structural elements of the Urban Plan). However, those outputs are not necessarily suitable, in terms of both spatial and thematic resolution, to address the second question (concerning the comparison of planning options). Particularly, some of these options might involve elements of the zoning scheme that need to be defined with more spatial accuracy than that of our ecosystem service maps;
• The actual capability of the city administration to produce updates of the ecosystem service assessment over the next years is an issue that needs to be addressed if the results are to be used to guide the implementation of the Urban Plan and to propose future revisions.