
Slideshow:
Oslo has been one of the fastest growing metropolitan areas in Europe (Stange et al. 2018). However the area that is available for development is limited by the protected Marka forest surrounding the city to the north and east, and the fjord to the south. The growing population is being accommodated at the rate of around 3000 new buildings every year and the need for 100 000 new buildings is predicted by 2030 (Oslo Municipal Plan 2015-2030). Oslo has the highest species diversity of any municipality in Norway, with a large number of species found in-between buildings in the built zone. Open public spaces include calcareous islands, coastlines and meadows within the city with high floral species diversity. Recent surveys found half of Norway’s bumblebee species within the built zone. Having up-to-date spatial data on the natural environment is important for decision-making and good planning of development (White paper – Norway’s national biodiversity action plan 2015-2016), and essential for the effective conservation of biodiversity.
The city’s Urban Ecology Programme (2011-2026) states that Oslo will maintain and strengthen its blue-green structure and that urban development will be environmentally sustainable, with an environmentally sound built environment and urban spaces. Furthermore, urban open space will be preserved (primarily for recreation and public health, but also for biodiversity, mobility and climate change adaptation) and further developed as the city grows (Oslo Municipal Plan 2015-2030). In order to achieve these goals, it is necessary to:
- Map which areas of the city have the highest potential for recreation and pollination
- Assess the accessibility to recreation opportunities (Municipal plan section 2, priority 4)
- Monitor changes in the quality of ecosystem services over time
The Oslo city lab has been involved in mapping and assessing ecosystem services in the urban environment since NINA’s involvement in the EU OpenNESS project (2012-2017). In this project, the ESTIMAP methodology was used to model recreational opportunities and pollination potential. The EnRoute project provided an opportunity to reproduce these models using different data inputs, including a satellite derived land cover map and the results of a survey that could be used to weight the data. The models were also applied at a regional scale by the Urban Experimental Ecosystem Accounting (Urban EEA) project. Mapping recreation potential was chosen because 1) it is highlighted as a priority in Oslo’s municipal plan (2015-2030), and 2) NINA has extensive experience with mapping and modelling recreation potential in Oslo. We also wanted to include a regulating service and pollination is a good indicator of biodiversity, a key element for assessing whether Oslo has met its goal of environmental sustainability. These choices were ratified by the lab’s city representative.
The URBAN SIS project has mapped experiential qualities of outdoor recreation areas in eastern Oslo, using the same Norwegian methodology (M98) as used by municipalities to validate the ESTIMAP regional models using high resolution local data. The URBAN SIS projects has also sought to validate ESTIMAP pollination through field surveys in Oslo of flowering plants and pollinators. The ENABLE project has contributed to documenting floral diversity in the built zone through DNA analysis of pollen samples collected from urban bee keepers. The Bee Dance project has documented the flight distance of honey bees in the urban environment in order to assess possible habitat conflicts with wild pollinators.
The ESTIMAP models provide a useful tool for monitoring changes in the quality of ecosystem services over time. This information needs to be communicated to the relevant audience and submitted to the mapping authorities to be made publicly available. A pitfall in research is that this type of information tends to be shelved because of limitations in the approach. This can be avoided through proper documentation of the methodology and shortcomings. Communication of the results is key to the success of this project.
|
Regulating and maintenance ecosystem services |
|
|
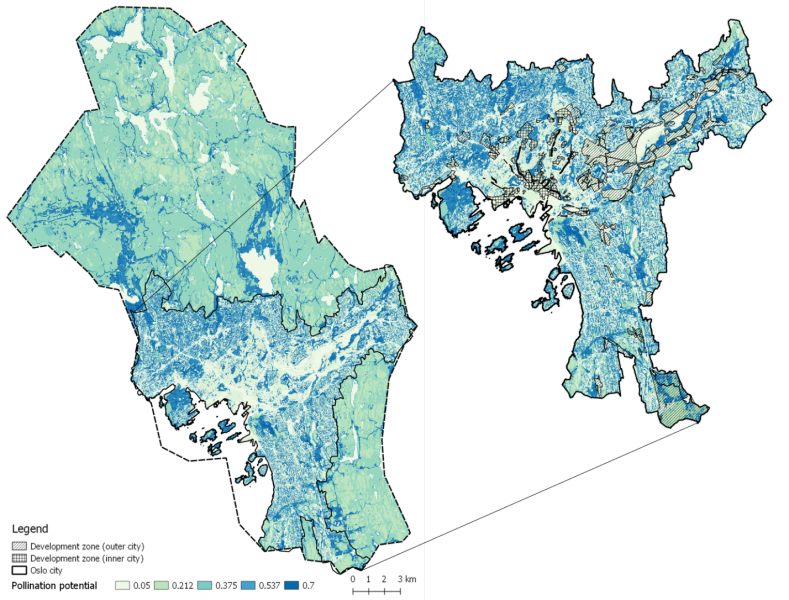
Insect pollination |
Relative pollinator habitat suitability |
|
Cultural ecosystem services |
|
|
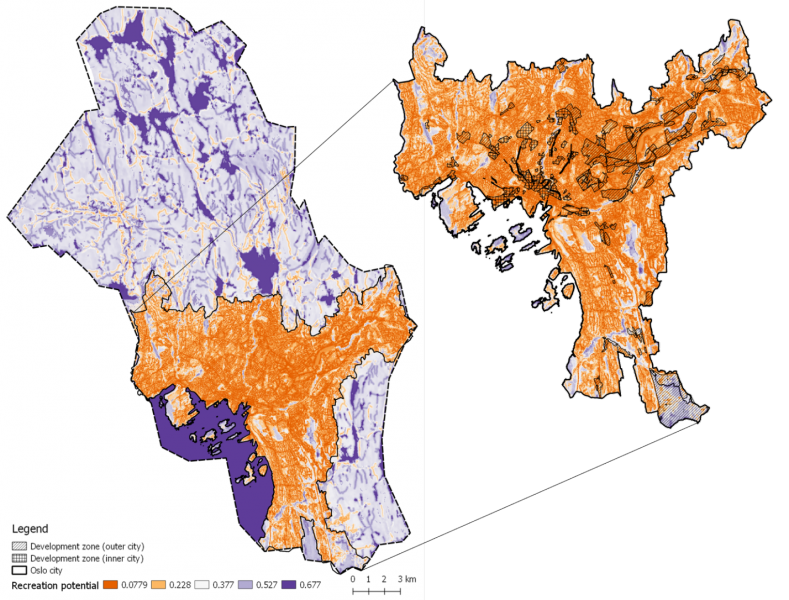
Nature-based recreation |
Recreational opportunity capacity |
|
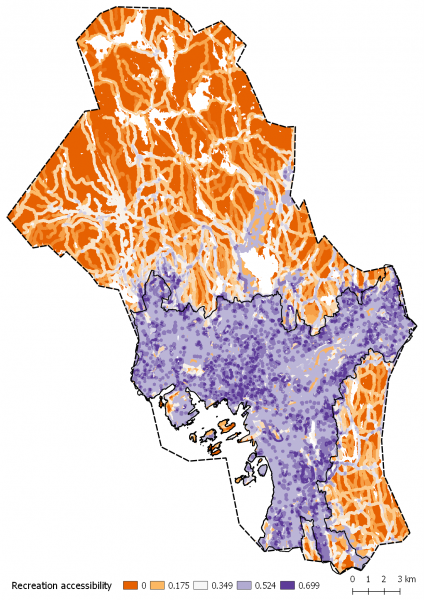
Recreational opportunity accessibility |
|
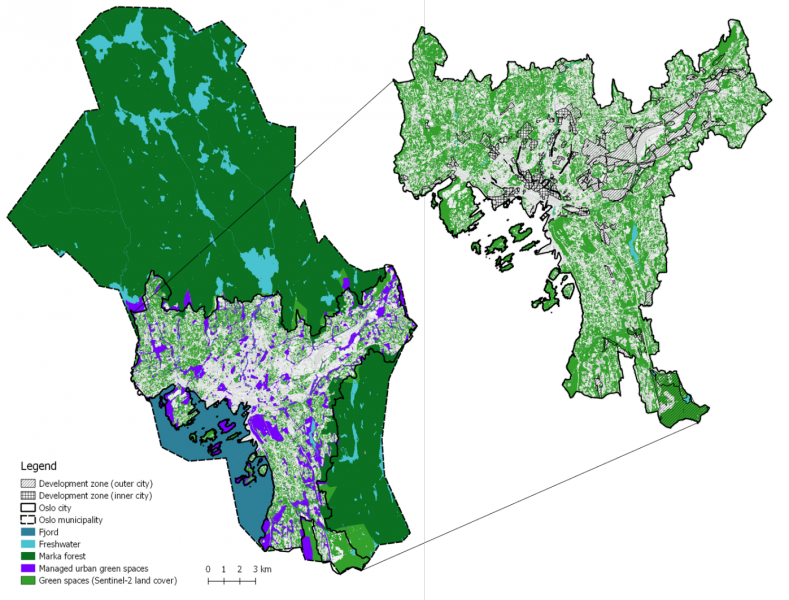
The following four figures synthesize the key outcomes of the city lab: a map of Oslo's urban green space, a map of pollination potential delivered by urban green space and two maps that describe the possibilities for recreation.
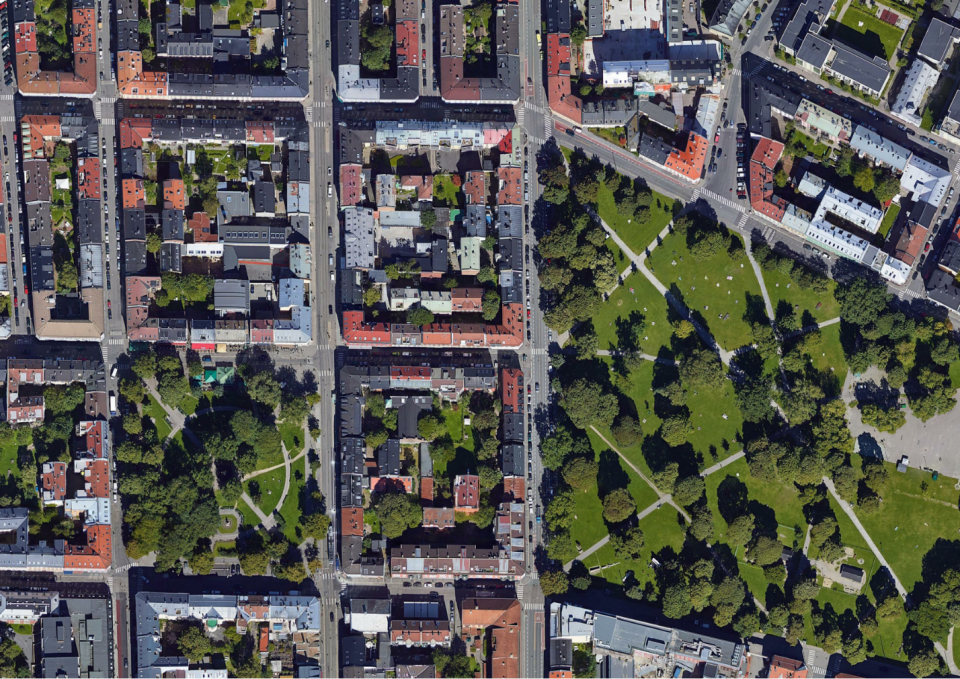
Map 1: Development in the city of Oslo is limited by the protected Marka forest to the north and east by and by the fjord to the south. Managed urban green spaces amount to 18% of the city’s urban area while Sentinel-2 derived land cover maps estimate that up to 47% of the city is green.
Map 2: Pollination potential was modeled using ESTIMAP. The map shows that areas with low-density housing in the north-west and southern parts of the city have the highest potential. There is not much overlap between the areas of high potential and development, however the development areas may hinder connectivity and movement of pollinators in the city.
Map 3: Recreation potential scored highest in Oslo’s surrounding Marka forest. Recreation potential needs to be increased in the development areas to meet the priorities of Oslo municipality.
Map 4: Recreational opportunities are most accessible in the city and the parts of the Marka forest that are closest to the city boundaries.
Map 5: ESTIMAP Pollination has been used to illustrate the relative habitat suitability to urban bee keepers. Map: Erik Stange
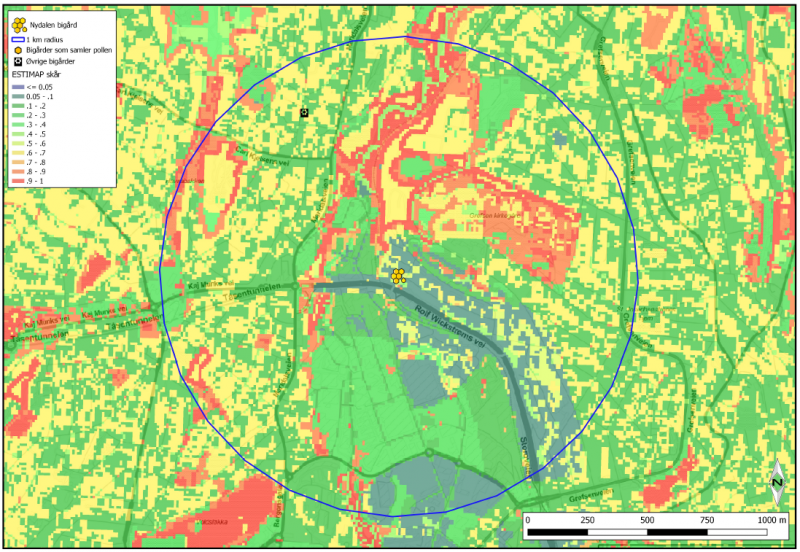
ESTIMAP pollination has been useful as an awareness raising tool provided cartography is well done. We have used it to illustrate the potential habitat at local level to bee keepers (Figure 5). ESTIMAP pollination has also been used to stratify more detailed assessments of pollinator habitat potential in the urban built zone, as input to an analysis of sensitivity of habitats for wild pollinators, and zoning of domestic honey bees. ESTIMAP’s qualitative approach of pollinator potential is not sufficient to address questions of (absolute) carrying capacity in terms of number of domestic beehives per km2 in the urban area, with regards to (i) available floral resources (ii) competition with wild pollinators. As such we have fallen short of the municipality’s needs for quantitative ecosystem service analysis of pollinator carrying capacity.
ESTIMAP recreation has been useful as a conceptual analysis tool. The implementation of ESTIMAP Recreation by NINA-JRC in Oslo coincided with a national decision by the Norwegian Environment Agency to implement “mapping and valuation of outdoor recreation areas” in all municipalities in the country by 2019. The so-called M98 Report from the agency defines a number of valuation criteria/layers and a valuation method which does not coincide with the European/ESTIMAP approach. The Norwegian method is also based on mapping and valuation carried out by local stakeholders and residents in city districts (bottom-up), while ESTIMAP is a GIS-data expert driven top-down approach.
NINA has participated in the M98 working group for Oslo. An advantage of simultaneously working with ESTIMAP modelling was that we could suggest to the municipality that they were underutilizing their available GIS data on recreation area qualities. To this end we carried out an experiment mapping the same polygons in Eastern Oslo as in the M98 project, but using only available GIS data, in the spirit of ESTIMAP. This result can be compared to ESTIMAP Recreation at Regional/European level and can also be compared to the bottom-up results when they are ready later this year. ESTIMAP cannot replace the locally mandated M98 mapping and valuation of outdoor recreation conducted by Norwegian municipalities (2017-2019), but a comparison of ESTIMAP and M98 can show the extent to which ESTIMAP Recreation is relevant for zoning studies at local level.
At a whole city and metropolitan area level, it is expected that ESTIMAP recreation and pollination will be useful for aggregate level ecosystem accounting, by working as “allocation surfaces” for provincial level recreation and pollinated crop demand statistics.
The Oslo city lab has mapped two ecosystem services that are relevant to the targets about the sustainable development of Oslo and its green space. As this data is based on remote sensing data, it can be used to monitor changes in the quality of urban green spaces over time. The ESTIMAP model provides a consistent methodology that is applicable at multiple scales and over larger extents. It has already been applied at the regional scale in the Urban Experimental Ecosystem Accounting project (Urban EEA). Based on our experiences with communicating ESTIMAP results we feel further guidance is needed on ecosystem service cartography, especially for the purposes of ecosystem accounting. When interpreted at local level the polygons defining land use impart an “apparent spatial accuracy”, which belies their use as allocation surfaces for statistics on demand that are often much more aggregated. The resulting ecosystem service maps give the impression of spatially resolved information on services when this is often not the case. This is not apparent at the aggregate European or national scales, yet becomes apparent at local/municipal scales when local inhabitants and experts easily can validate the relative values in the map based on personal experiences. Often, it is sufficient for one stakeholder participant to find one local deviation in a polygon or raster pixel during a consultation for the whole product to be invalidated in front of the audience. There is a gap between maps interpreted as likelihoods and maps used to support local narratives.
Further information
POLLINATION
Modelling the pollination potential was challenging because pollinators generally utilize very fine-scale green spaces and the data was simply not available at this spatial resolution. We used a 10x10m pixel land cover map derived from Sentinel-2 imagery which had the advantage of covering a large extent, thereby ensuring consistency in the model. However a finer spatial resolution would have been more suitable for pollinators. At this resolution, individual bushes, narrow strips of grass along roads or green roofs could not be detected. Using a remote sensing derived land cover map at pixel level also meant that classification errors would have a large influence on the results of the model. The land cover map had a classification accuracy of 86%, sufficient for modelling larger-scale phenomena, yet contributing considerable error to the ESTIMAP results. No validation of the model has been done to determine the accuracy. Another limitation that should be taken into account is that pollinators occupy a 3-dimensional environment while the data inputs of the model were 2-dimensional. This could be addressed by including building and tree height, and by looking at connectivity and visibility. The resulting pollination potential map is a qualitative map of relative pollinator habitat suitability and therefore cannot be used for zoning of bee keeping.
RECREATION
One of the challenges that was faced was classifying urban green spaces in Oslo. Different spatial data sources had different definitions for what an urban green space was. This was overcome by merging all of the datasets. However this made it difficult to assign scores according to the hemeroby scale (Paracchini and Capitani, 2011). Urban green spaces were given the same score in accordance with the hemeroby scale even though they differed greatly in their degree of naturalness. Another shortcoming of the ESTIMAP model was that it was biased towards terrestrial recreational activities and did not include preferences for aquatic recreation opportunities. As the scoring was based on ‘naturalness’, rivers, lakes and the sea all had the highest score. Several of the indicators that we had planned to include in the model were not included because we were missing the appropriate methodology or data (ex. Degree of management, type of path, etc.).