
Slideshow:

In Manchester, the EnRoute CityLab has been built on the three main ‘policy pillars’ relating to the environment in the city (Our Manchester: A vision for the Future; Manchester’s Great Outdoors: A Green and Blue Infrastructure Strategy for Manchester, and the Manchester Climate Change Strategy 2017-2050) and their core ethos of ‘biodiversity innovation and citizen action for nature’.
Manchester’s green infrastructure (GI) has been part of the city’s success for a number of years, but in 2015 the City Council recognised that, as the city continues to grow over the coming decades, existing and new GI will need to continue to be an integrated part of this growth. In 2015, they produced the now award-wining (CIEEM, 2018) City of Manchester Green and Blue Infrastructure Strategy, which sets out how this will be achieved over the coming decade, drawing together existing commitments on GI and progress achieved to date, to provide a framework for scaling up this good work and the basis for driving new investment over the coming decade.
The GI Strategy sets out four objectives that would enable the vision to be achieved: 1. Improve the quality and function of existing green and blue infrastructure, to maximise the benefits it delivers; 2. Use appropriate green and blue infrastructure as a key component of new developments to help create successful neighbourhoods and support the city’s growth; 3. Improve connectivity and accessibility to green and blue infrastructure within the city and beyond; 4. Improve and promote a wider understanding and awareness of the benefits that green and blue infrastructure provides to residents, the economy and the local environment.
During the Local Action Project and the EnRoute CityLab a simple, but rigorously scrutinised, framework was developed for the assessment of natural capital- and ecosystem services-derived benefits in urban landscapes.
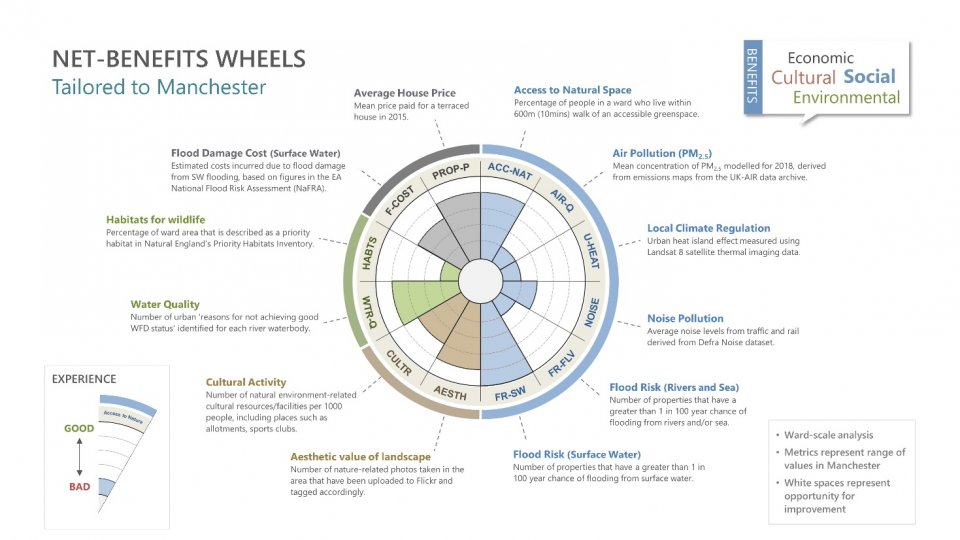
The aim was for the framework to be co-created, refined and tailored through consultation with local stakeholders and with locally-specific data and evidence. This would lead to the creation of a resource that becomes a powerful enabler for people attempting to deliver local actions in the urban environment. The assessment method characterises a series of 12 indicators, visualised in a wheel graphic, which can be used to establish a baseline of the net-benefits experienced by people living in a specific or across a number of communities (facilitating a strategic assessment of the ‘need for enhancement’ or the deficiency of provision). Once created, the wheels become a powerful ‘knowledge-brokerage’ or decision-support tool that can facilitate a strategic and collaborative spatial prioritisation of ‘need’ for the protection, improvement or creation of natural capital assets - i.e. they help build a mandate for action and target that action into the areas of greatest potential benefit.
For each area or landscape under study, the Super Outputs Areas (SOAs) or wards (in the case of Manchester) were ranked for each of the 12 indicators. This then enables the ‘Net-Benefit Wheels’ to be created and mapped to give a strategic overview of the ecosystem services or natural capital ‘needs’ of the people living in each community. By giving stakeholders (citizens, civil society and professional) an engaging and highly visual multi-parameter assessment of need/opportunity for action, the Wheels stimulate an informed discussion among local stakeholders, practitioners and decision-makers. This in turn should help them build consensus/ambition, develop a shared vision and expedite a more robust and informed decision-making process at a local scale.
In the City of Manchester, the previous work already undertaken for Local Action Plan (LAP) was built upon under the EnRoute Project through a series of workshops with practitioners, other professional stakeholders and policy-makers. In these workshops the stakeholders worked to scrutinise the indicators developed for the original wheel and, where they considered it appropriate, change either the metrics, the data used to calculate them, or the methods used to analyse them for the city.
The LAP approach includes a simple, but consistent and robust framework for the assessment of natural capital- and ecosystem services-derived benefits in urban landscapes has been developed. The multi-indicator graphics produced have been referred to as Ecosystem Service Benefits ‘Wheels’.
The EnRoute approach adopted in Manchester was a genuinely collaborative approach between the technical research team and the policy-lead from the City Council. Numerous studies (see www.watergov.org) have now shown that undertaking a stakeholder-led participatory systematic review of data and evidence relating to a landscape, when facilitated by an impartial ‘knowledge broker’, can help to achieve a number of critical outcomes in the catchment planning process:
Metric 1 – Access to natural space
There are several methods for this, but we calculate the percentage of residential houses that are 600m from accessible natural green space of >1ha in size or 600m from accessible blue space or 600m from a rural public right of way and an extra point if there is >1ha of natural space per 1000 people.
|
Dataset Type |
Name |
Owner/Source |
Access |
|
Accessible Local Wildlife Sites |
Local datasets – may not exist for all urban areas Alternatives – County Wildlife Sites, Sites of Biological Importance N.b. Local knowledge needed to determine accessibility |
Local Records Centre or Local Authority |
Dependent on local circumstances |
|
Common land |
Conclusive Registered Common Land |
Natural England |
Open data via NE GIS datasets web page |
|
Country parks |
Country Parks |
Natural England |
Open data via NE GIS datasets web page |
|
Open access land |
CROW Access Combined |
Natural England |
Open data via NE GIS datasets web page |
|
Doorstep greens |
Doorstep Greens |
Natural England |
Open data via NE GIS datasets web page |
|
Forestry Commission Walkers Welcome woodland |
Walkers Welcome |
Forestry Commission |
Available upon request from the owner |
|
Local Authority PPG17 datasets |
Local datasets – May include amenity greenspace, outdoor sports areas (natural), allotments, cemeteries, CYPS (natural) |
Local Authority |
Dependent on local circumstances |
|
Local Nature Reserves |
Local Nature Reserve |
Natural England |
Open data via NE GIS datasets web page |
|
Millennium greens |
Millennium Greens |
Natural England |
Open data via NE GIS datasets web page |
|
Accessible National Nature Reserves |
National Nature Reserve (selected) N.b. Local knowledge needed to determine accessibility |
Natural England |
Open data via NE GIS datasets web page |
|
Village greens |
Village Greens |
Natural England |
Open data via NE GIS datasets web page |
|
Accessible woodland |
Woods for People – Accessible Woodlands |
The Woodland Trust |
Available upon request from owner, with some usage constraints |
|
Rivers |
Detailed River Network |
CEH |
Available via CaBA Data Package v1 |
|
Lakes |
MasterMap (desgroup = Inland Water) |
Ordnance Survey |
Commercial – some NGOs have access via EA DataShare |
|
Paths |
MasterMap (desgroup = Path) |
Ordnance Survey |
Commercial – some NGOs have access via EA DataShare |
|
Public Rights of Way |
Local dataset – may not exist for all urban areas. |
Local Authority |
Dependent on local circumstances |
|
Roads |
MasterMap (desgroup = Road Or Track) |
Ordnance Survey |
Commercial – some NGOs have access via EA DataShare |
|
Population |
Population density |
2011 UK Census |
Open data via Nomis Web |
Metric 2 – Air quality
Mean concentration of PM2.5. This could be adjusted to use emissions data in combination with modelled air quality and/or to look at an array of different pollutants. This pollutant was selected as it has the highest correlation with health impacts, but the evidence relating to other pollutants is growing all the time and they may need to be considered. It is also worth noting that air quality (as measured by emissions) is not really an ecosystem service – natural assets in an urban landscape act to clean air, but the final air quality is the net integrated effect of two opposing factors.
|
Dataset Type |
Name |
Owner/Source |
Access |
|
PM2.5 concentration |
PM2.5 2016 Estimated Background Air Pollution Maps (base year 2011) N.b. Total annual mean concentrations based on 1 km x 1 km grid squares |
Defra UK-AIR |
Open data via UK-AIR website |
Metric 3 – Local climate regulation
There are a number of methods for looking at average surface temperature, but we use Landsat imagery at present. The key challenge is obtaining the best, most appropriate satellite image for the assessment and Manchester Metropolitan University, among several others, have been undertaking research into this that will inform the refinement of this metric.
|
Dataset Type |
Name |
Owner/Source |
Access |
|
Land surface temperature |
Landsat 8 TIRS |
United States Geological Survey |
Open data via the USGS Earth Explorer website |
Metric 4 – Noise pollution/tranquillity
The source of outdoor noise machinery or transport systems, but can also include loud music, lawn care maintenance, construction or people yelling (sports games). High noise levels can damage cardiovascular health in humans and can interfere with predator-prey interactions, reproduction and navigation in wildlife. Children are especially vulnerable to noise, and the physical and psychological health effects that noise has on children may be permanent.
|
Dataset Type |
Name |
Owner/Source |
Access |
|
Strategic noise mapping |
Strategic noise mapping - modelled noise from road & rail |
Defra |
Open Government Licence from data.gov.uk |
Metric 5 – Flood risk from rivers and sea
Number of properties that are situated in 1 in 100-year flood zones (rivers and sea). We use the number of properties in a management unit as the indicator, as density does not give a clear indication of the magnitude of the problem in any one unit – this, of course, is open for discussion, but we reasoned that every property at risk is another household or business suffering the negative consequences of living at risk of flooding or actually being flooded.
|
Dataset Type |
Name |
Owner/Source |
Access |
|
Risk of Flooding from Rivers & Sea |
Risk of Flooding from Rivers and Sea |
Environment Agency |
Available via CaBA Data Package v2 |
|
Buildings |
MasterMap (desgroup = Building) |
Ordnance Survey |
Commercial – some NGOs have access via EA DataShare |
Metric 6 – Flood risk from surface water
Number of properties that are situated in 1 in 100-year flood zones (surface water). We use the number of properties in a management unit as the indicator, as density does not give a clear indication of the magnitude of the problem in any one unit – this, of course, is open for discussion, but we reasoned that every property at risk is another household or business suffering the negative consequences of living at risk of flooding or actually being flooded.
|
Dataset Type |
Name |
Owner/Source |
Access |
|
Updated Surface Water Flood Map |
Updated Flood Map for Surface Water – Basic Package |
Environment Agency |
Available from EA DataShare |
|
Buildings |
MasterMap (desgroup = Building) |
Ordnance Survey |
Commercial – some NGOs have access via EA DataShare |
Metric 7 – Aesthetic value of the landscape (Nature photo hotspots)
It is an increasingly common approach to use tagged social media or online posts (in this case the number of nature-tagged geo-located photos on Flickr) as an indicator of landscape quality.
|
Dataset Type |
Name |
Owner/Source |
Access |
|
Flickr nature-tagged photos |
- |
Flickr |
Open data via Flickr API N.b. nature-related tags entered here (max. 20) |
Metric 8 – Cultural activity facilities
This metric is designed to assess the provision of cultural spaces/resources within a landscape and we use a variety of data sources to map features where cultural activities can be undertaken. These include features such as the number of allotments per 1000 people, area/number of playing fields per 1000 people, and the number of outdoor sports clubs per 1000 people.
|
Dataset Type |
Name |
Owner/Source |
Access |
|
Allotments |
Local dataset – may not exist for all urban areas* |
Local Authority |
Dependent on local circumstances |
|
Playing fields |
Local dataset – may not exist for all urban areas* |
Local Authority |
Dependent on local circumstances |
|
Outdoor sports clubs |
AddressBase (selected addresses) or Sports clubs (manually located and plotted) |
Ordnance Survey Sports Clubs Directory |
Commercial Postcodes available from Sports Clubs Directory website |
|
Population |
Population density |
2011 UK Census |
Open data via Nomis Web |
|
*An alternative method for identifying this feature is to use MasterMap Cartographic Text; however it is not as easy or as accurate. |
|||
Metric 9 – Water quality
This is assessed using the number of urban-caused ‘Reasons for Not Achieving Good Status’ recorded in the Environment Agency WFD assessments as an indicator for the level of complexity in and magnitude of ecological/water quality degradation. This indicator is being improved for the EnRoute assessment – especially as the Manchester WFD data is not very robust.
|
Dataset Type |
Name |
Owner/Source |
Access |
|
Reasons for Not Achieving Good Status |
RBMP2 RNAG Water Body Data Dec2015 |
Environment Agency |
Available from EA DataShare |
|
River waterbody catchments |
WFD River Waterbody Catchments Cycle 2 |
Environment Agency |
Open data via DATA.GOV.UK |
Metric 10 – Priority habitats for wildlife
As a simple indicator of wildlife habitat provision and biodiversity in an urban landscape we assess the percentage area of priority habitats in each ward. The key analysis stage in this is to obtain/create an inventory of natural habitats in the urban landscape, which we are still working to do using data from a variety of sources. Building on this, we are now developing new approaches to assessing provision of habitats and the performance of the ecological network (connectivity and patch size).
|
Dataset Type |
Name |
Owner/Source |
Access |
|
Priority Habitats Inventory |
Priority Habitats Inventory |
Natural England |
Open data via NE GIS datasets web page |
Metric 11 – Surface water flood damage cost
This is calculated using the published National Flood Risk Assessment (NaFRA) methodology created and previously used by the Environment Agency. Due to data availability restrictions, we have created a simplified version of this assessment (approached by the EA) and we have adapted it to calculate the average estimated cost of flood damages from surface water flooding (rather than the fluvial and coastal flood risk assessment data it was designed for). We believe that this is a more relevant indicator for urban ESS (including GI and water management).
|
Dataset Type |
Name |
Owner/Source |
Access |
|
Updated Surface Water Flood Map |
Updated Flood Map for Surface Water – Basic Package |
Environment Agency |
Available from EA DataShare |
|
Residential properties |
AddressBase (residential addresses selected) |
Ordnance Survey |
Commercial |
|
Commercial properties |
AddressBase (commercial addresses selected) |
Ordnance Survey |
Commercial |
|
Buildings |
MasterMap (desgroup = Building) N.b. Use if AddressBase unavailable |
Ordnance Survey |
Commercial – some NGOs have access via EA DataShare |
|
Agricultural land classification |
Agricultural Land Classification |
Natural England |
Open data via NE GIS datasets web page |
|
Estimated flood damage values |
System Asset Management Plans – Benefits Manual (NaFRA) |
Environment Agency |
May be available upon request |
Metric 12 – Property value
We have explored numerous ways to assess this indicator. It is a controversial metric as there are many interpretations of it and it has a great deal of social impacts/causes of the variation in the scores. It is included in our assessment purely as an economic indicator on the basis that house prices/values and business outputs are positively correlated (albeit with huge additional factors involved) with environmental quality in an urban landscape. To assess this indicator, we assess the mean price paid for a terraced house in 2014 and 2015. This indicator may be replaced in the final assessment – especially if the stakeholders consulted regard it as being too controversial.
|
Dataset Type |
Name |
Owner/Source |
Access |
|
House prices |
Price Paid Data (terraced house in 2014 and 2015 selected) |
Land Registry |
Open data via DATA.GOV.UK |
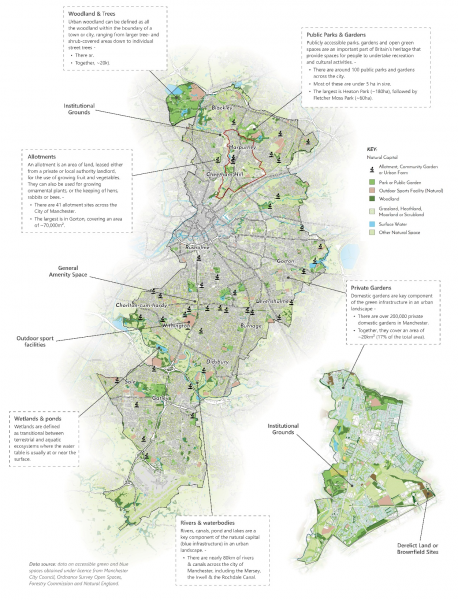
It is first vital to perform a comprehensive audit of the environmental infrastructure (natural capital in the landscape) and to characterise the ecosystem services these assets currently provide. This review allows assets providing important benefits to be identified and provides evidence in support of efforts to protect and enhance them. In addition, it is vital to characterise the current natural capital in the landscape to ensure that any proposed programme of interventions designed to enhance provision is strategic and correctly targeted. Several organisations in Manchester have collaborated to produce highly detailed datasets describing the location and character of natural capital assets across the city.
The map (below) shows the broad array of natural capital types we can map using this data.
The maps presented below illustrate 4 of the 12 indicators identified as being important for ecosystem services assessments to be made in Manchester.
- Access to green & blue spaces (top left). This map shows the natural spaces included in the analysis; accessible green spaces greater than 1ha, accessible water environments, rural footpaths and minor roads. The indicator used for this assessment shows the percentage of people in a ward who live within 600m (10mins) walk of an accessible green- or blue-space.
- Impacts of air pollution (top right). This map shows the estimated background air pollution maps available from Defra UK-AIR enable concentrations of particulate matter <2.5 microns (PM2.5) across the city. The indicator used for this assessment shows the mean background concentration of PM2.5 in in each ward during 2018.
- Local climate regulation (‘heat island effect’) (bottom left). This map shows thermal imagery data acquired from Landsat 8 showing temperature variation across the study area, during the summer months. The indicator used for this analysis is the average temperature in each ward as shown by Landsat 8 thermal imaging.
- Noise pollution & tranquillity (bottom right). This map shows Defra Strategic Noise Map data for the estimated noise from major road and rail sources across England in 2012. The data was developed as part of implementing the Environmental Noise Directive. The indicator used the Defra 2012 modelled noise maps to calculate the average noise levels in each ward.

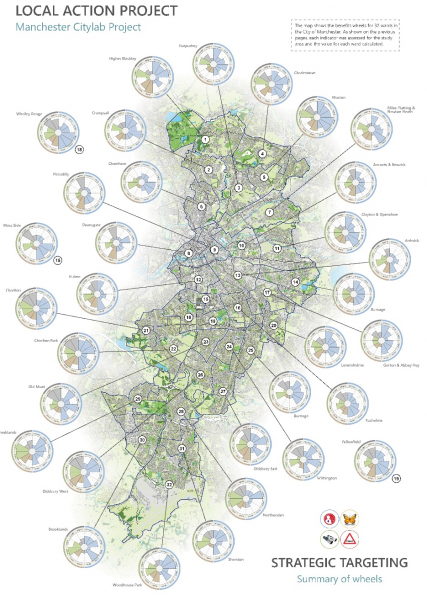
For each of the 12 indicators, the 32 wards in the City of Manchester were ranked and this then enabled the Benefit Wheels to be created and mapped to give a strategic overview of the ecosystem services needs of the people living in each community. The map (right) shows the benefits wheels for 32 wards in the City of Manchester.
By giving people an engaging and highly visual multi-parameter assessment of need/opportunity for action, the Wheels stimulate an informed discussion among local stakeholders, practitioners and decision-makers. This in turn should help them build consensus/ambition, develop a shared vision and expedite a more robust and informed decision-making process at a local scale.
Previous and current research has demonstrated that the approach is easily understood by non-technical audiences, engages stakeholders and facilitates conversations around levels of green infrastructure and opportunities for enhancement.
‘Flagships’ were used to send clear and vital messages to a fleet, to provide direction and clarity to all when focus was needed. Today, policies and strategies can be seen as the flags to which we rally to and around, with the fleet being our City and other partners. The flagship GBI Strategy, Manchester’s Great Outdoors (MGO) leads the way, in terms of highlighting the importance of green and blue infrastructure for cities, and completely repositions the GBI agenda in-line with other city specific thematic priorities, for example health and well-being and economic growth.
The EnRoute CityLab approach helps us to make a strong and compelling case in an accessible way – that GBI is the life support system for the modern city and is a key driver in realising the ‘Our Manchester Strategy’ livability ambitions. It provides us with a mechanism to engage with a range of stakeholders; from community leaders and politicians to business leaders. Its aim is to inform decision making and act as a catalyst for change.
MGO provides the strategic backdrop for a range of interventions including the capturing and monitoring of GBI activity across the city, celebrating best practice through city-specific case studies, positively influencing master planning and supporting funding bids. Its audience is broad, but its language is accessible.
It is truly a strategy made ‘for the city, by the city’ with 32 partner organisations having helped shape and deliver the strategy and Implementation Plan. For this ambition to be successfully realised, it needs to be underpinned with clearly articulated evidence such as the CityLab evidence review provides. MGO is being used a barometer for successfully delivering key elements of the city’s long term ‘Our Manchester’-vision and highlights the importance that the landscape plays in delivering this. The CityLab project reaffirms this and provides us with much needed evidence as regards the functionality of city GBI.
This innovative piece of work has been undertaken to look at the broad functionality of the city’s GBI, and helps, down to ward level, to identify priorities and possible interventions that could improve the functionality of our landscape, based on both need and opportunity. The CityLab has cleverly integrated data and findings from a range of detailed cutting-edge research outputs to help shape its analysis. For example, the ‘My back Yard’ project completely renewed the city’s understanding of the make-up of garden space in Manchester.
The EnRoute CityLab project has also provided us with a much needed GBI functionality assessment, refined and honed using the most up-to-date analysis tools and datasets available. Looking at the city through expert independent expert eyes provides us with the opportunity to develop creative, yet smart opportunities for integrating GBI into a modern, growing City. “The Westcountry Rivers Trust, leaders in the field of helping to bring ecosystem services analysis to life, have helped shape the Manchester CityLab and provided us with a completely new way of looking the the City’s landscape.”
In addition to these impacts locally in Manchester, the LAP-EnRoute approach/ethos has been specifically designed to help meet the objectives set out in the UK Government’s recently published 25-Year Environment Plan (25-YEP).
At its core, the 25-YEP is based on several key challenges that will require environmental practitioners and policy-makers to: 1) consider the value of nature in decision-making; 2) develop innovative tools and finance methods that use the latest science, data and technology; 3) plan and deliver action at the most effective scale and in a collaborative, inclusive and integrated way that breaks down silos; and 4) re-connect stakeholders with their local the environment and empower them to take action to protect and enhance it. It is designed to facilitate local, collaborative adaptive management of the environment by working to engage, inspire and empower local communities to protect and enhance the value of natural capital in their landscapes to improve quality of life (health and wellbeing), the environment & economic prosperity.
The aim was for the ecosystem services mapping framework developed under the EnRoute Project to be co-created, refined and tailored through consultation with local stakeholders and with locally-specific data and evidence. This would lead to the creation of a resource that becomes a powerful enabler for people attempting to deliver local actions to improve the local (various scales) urban environment.
Perhaps the key measure of success for this approach therefore, would be for the evidence generated to be practically applied to inform planning, policy- and decision-making in Manchester at a variety of spatial scales and, most importantly, ultimately to deliver genuine societal impact through the realisation of natural, social, cultural and economic benefits for the city and its communities.
Indeed, there is now evidence that this has begun to occur with the EnRoute evidence now being used to inform a current review of the Manchester GI Strategy and to target the delivery of new projects focused on protecting and enhancing GI, natural capital and ecosystem services provision in Manchester. There is no better example of this than the ‘Nature of Hulme’ project, which has been delivered as a direct result of the EnRoute CityLab study being undertaken over the last 2 years (see link to report in Section 12 of this report).
In addition, the LAT was designed to facilitate an informed dialogue between technical specialists/practitioners, knowledge brokers, civil society groups and the public to encourage and support local communities to take ownership of and be part of the solution to water-related issues in their urban landscape. This was intended to inspire and motivate them to take action by developing social capital and adaptation capacity through engagement and empowerment.
Another key success criterion for the project was the demonstration that the resources/approach developed can be up-scaled and/or transferred to new locations across the urban landscape or in other areas of the country at a variety of spatial scales.
Since it began, Local Action Project approach has been trialled in numerous pilot areas in addition to Manchester. Initially these included Leicester, Newton Abbot and Thames Estuary (East London) and, during the Manchester LAP/EnRoute CityLab Project, its transferability has also been tested in several other areas: 1) the small community of Millbrook in Cornwall; 2) the Greater Exeter Strategic Plan (a regional masterplan in Devon); 3) Taunton (in Somerset); 3) the Medway River Catchment (a large mixed urban and rural landscape), and 4) the urban community of Hulme (one of the 32 wards in Manchester). The outputs from some of these projects can be viewed via links in Section 12 of this report.
Perhaps the most significant limitations of this approach are related to the availability and quality of the spatial data required for the assessment of key indicators.
When setting a natural capital or ecosystem services baseline (a vital step in the process), mapping the natural assets themselves is now reasonably straightforward. In the UK this has recently been hugely facilitated by the Defra Open Data Project, which has, in response to the Inspire Directive and the UK Location Strategy, made nearly all government-owned environmental data freely available under a ‘Public Open Data License’. In Manchester, this has been further expedited by the high-quality GI datasets created and managed by Manchester City Council and their partners.
However, in the UK, there also several high quality and vital datasets that could contribute to this audit of natural assets, but which remain of limited use due to the fact that their availability is restricted by commercial interests.
The second key set of evidence required to set a natural capital or ecosystem services baseline is data that indicate the condition or quality of those assets – i.e. their ability to perform their ecosystem services functions and generate the benefits they have the potential to provide. These data are far more difficult to obtain and are where issues of spatial resolution and data quality are most keenly felt. Perhaps the best example of this is in relation to data on water quality and ‘reasons for not achieving good WFD status’ in urban landscapes, which is generally of low quality and is currently undergoing some deterioration due to reductions in funding for environmental monitoring.