

Images
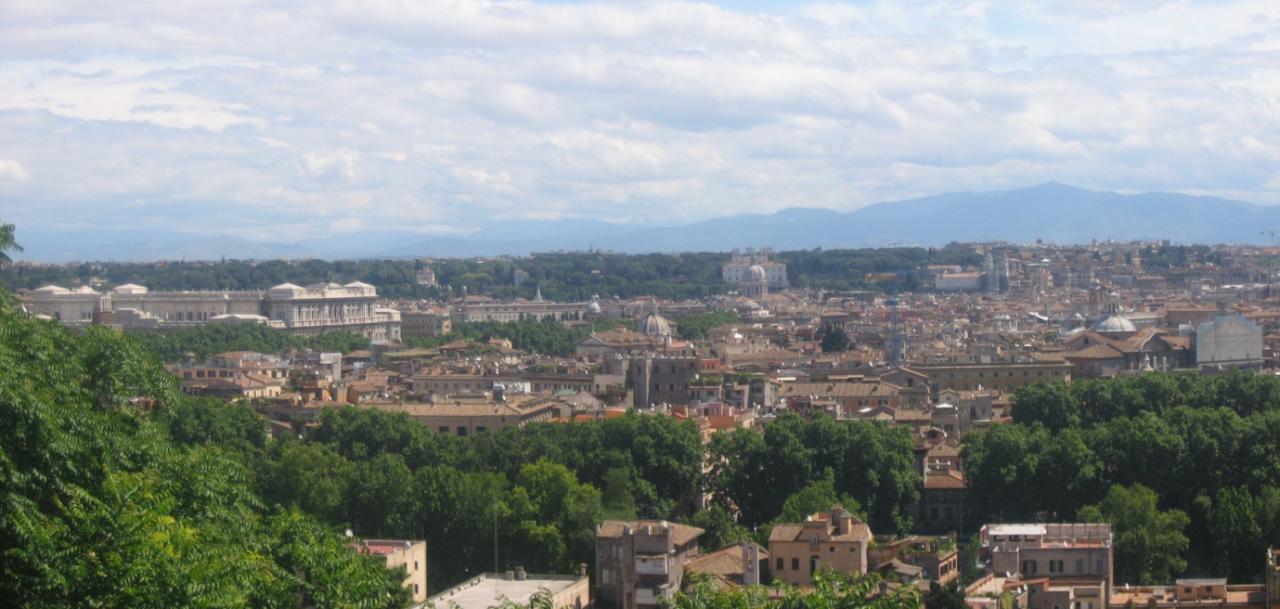
“Roma as seen from Gianicolo Hill” by Mac9 - licensed under CC BY-SA 2.5
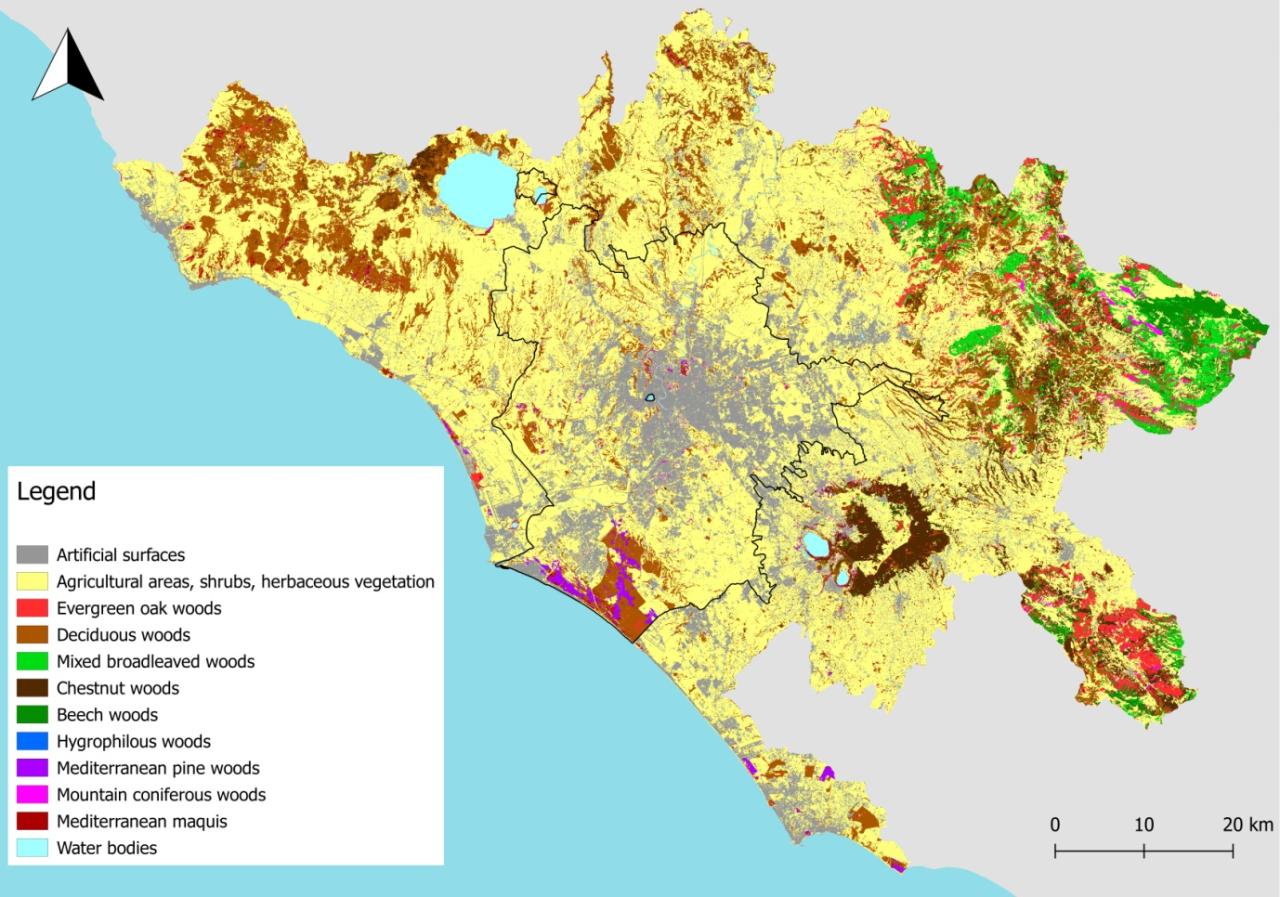
Map of the Metropolitan City of Rome – land cover classification (Sentinel 2)
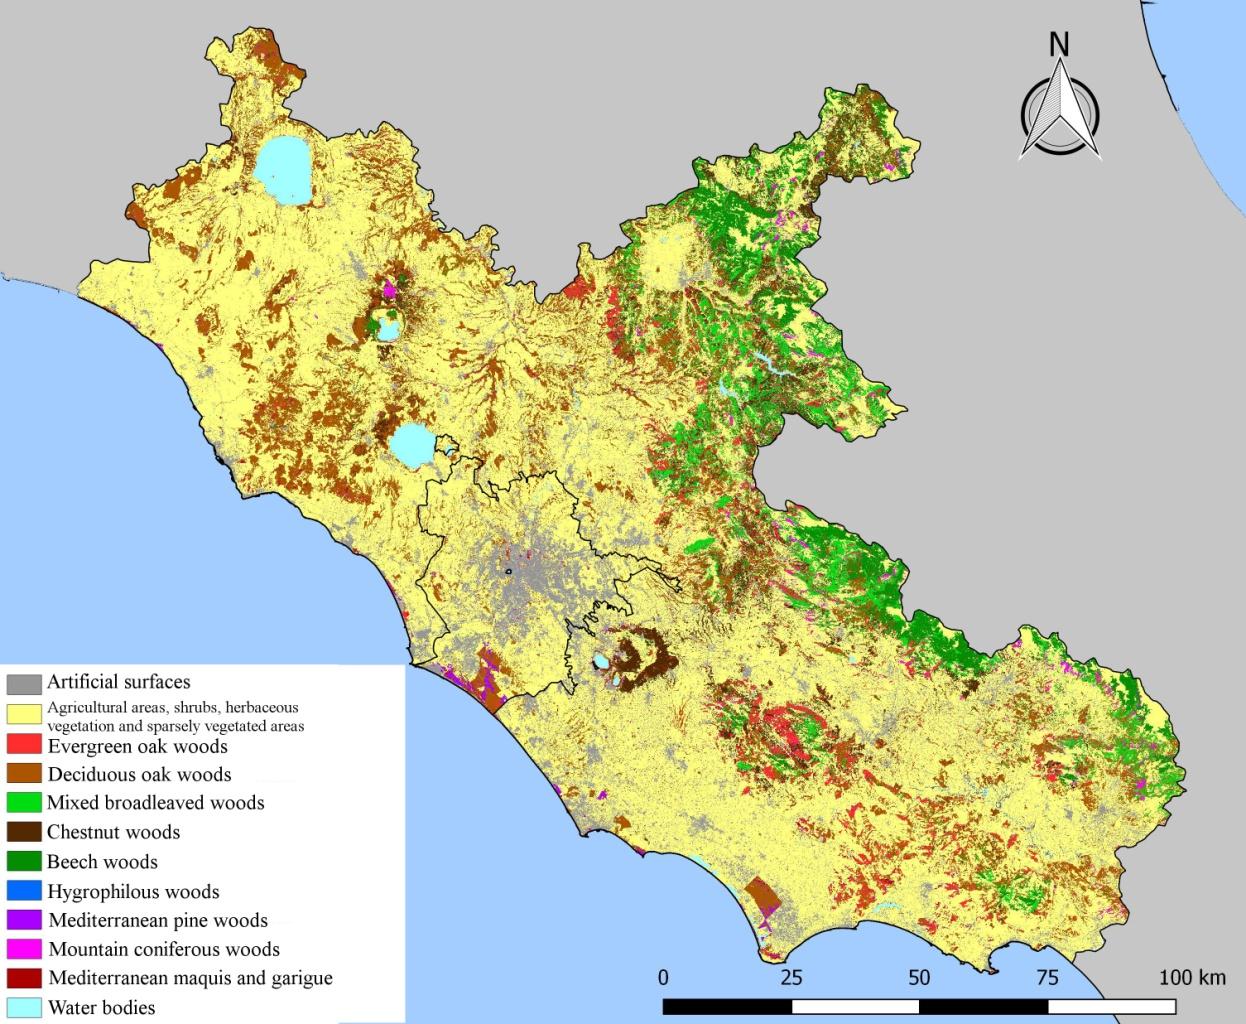
Land cover classification of the Latium region from a Sentinel-2 image – year 2016 (10 m2 spatial resolution). The classification yielded 11 different land cover classes, including 7 different physiognomic-structural categories of vegetation. The area i
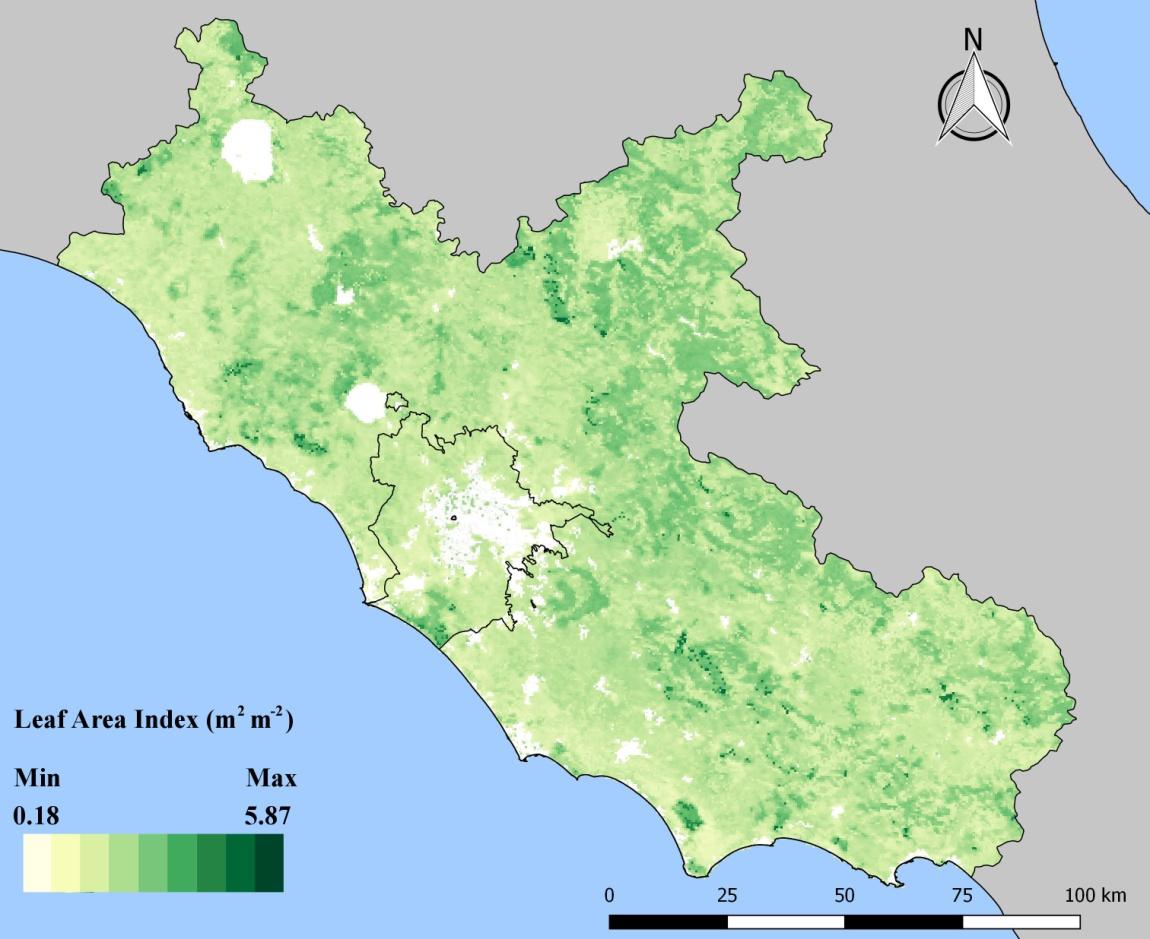
Figure 2: Yearly average Leaf Area Index (LAI, m2/m2) values (2016) retrieved from the MOD15A2H MODIS product for the Latium region. Higher LAI values can be found in correspondence of dense forest stands, in particular in peri-urban areas. The area insid
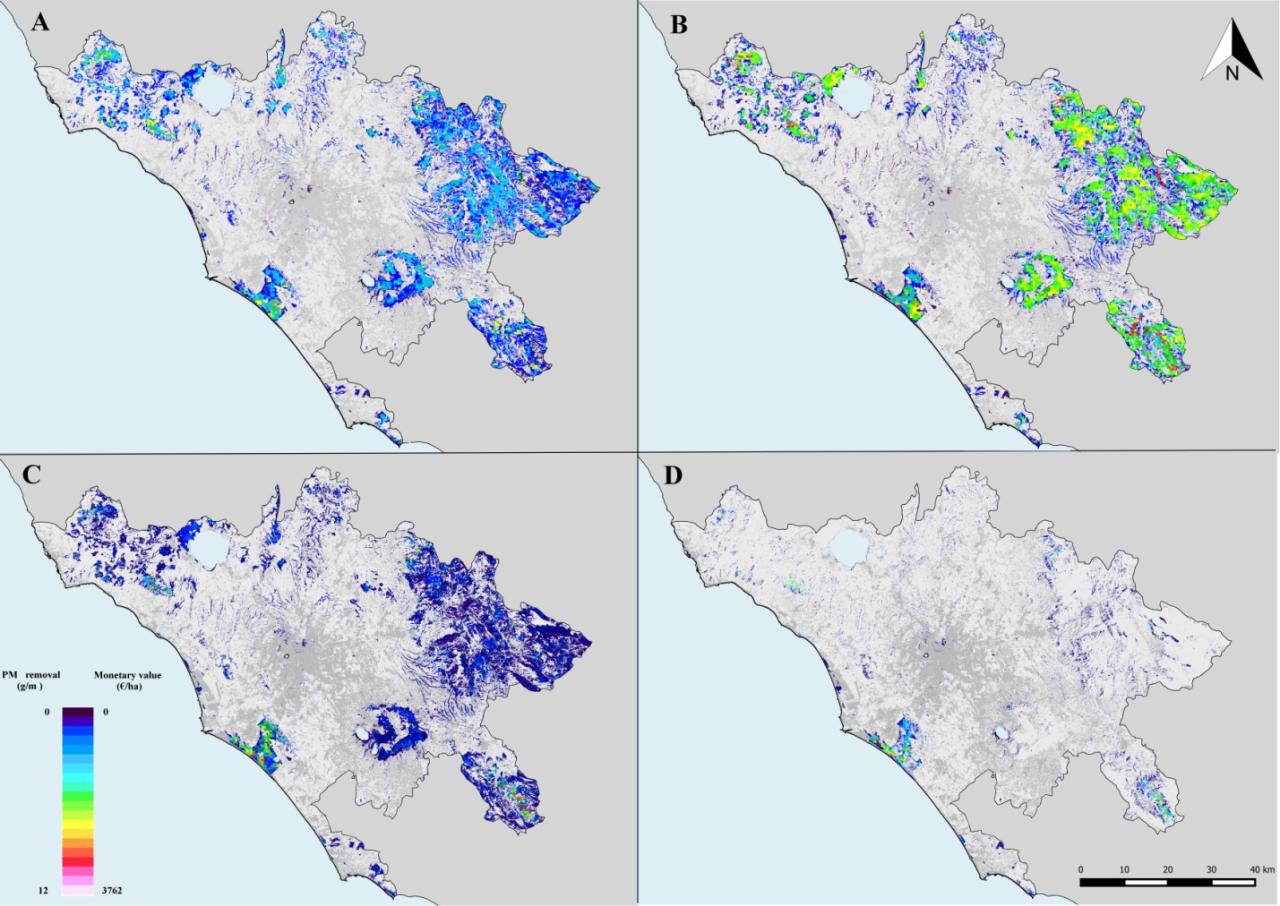
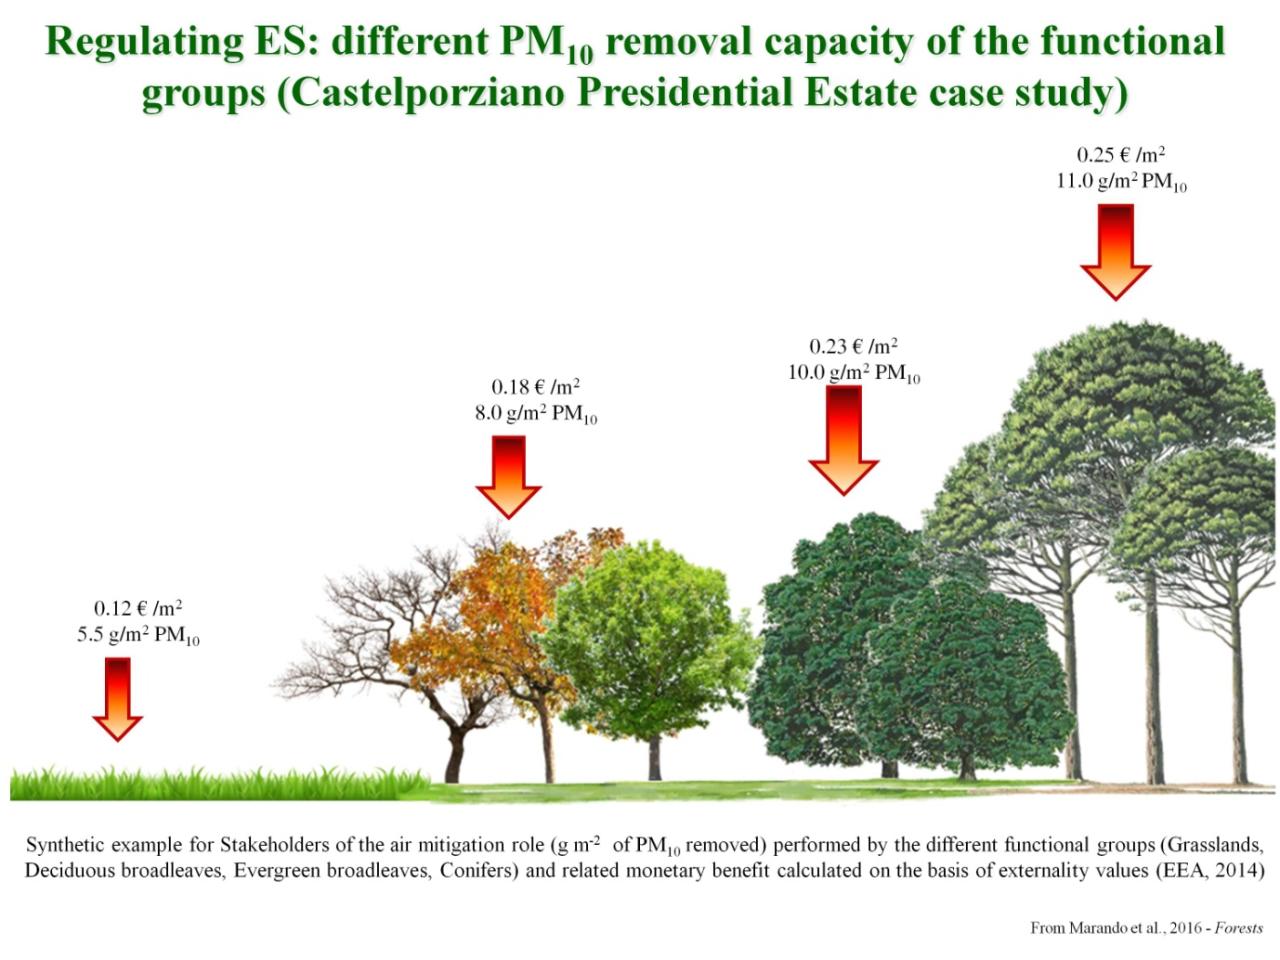
Figure 3: seasonal PM10 removal by the vegetation of the Metropolitan City of Rome (in g/m2), calculated following the methodology described in Marando et al. (2016) using monitoring stations data for PM10, and relative monetary value (in €/ha) calculat
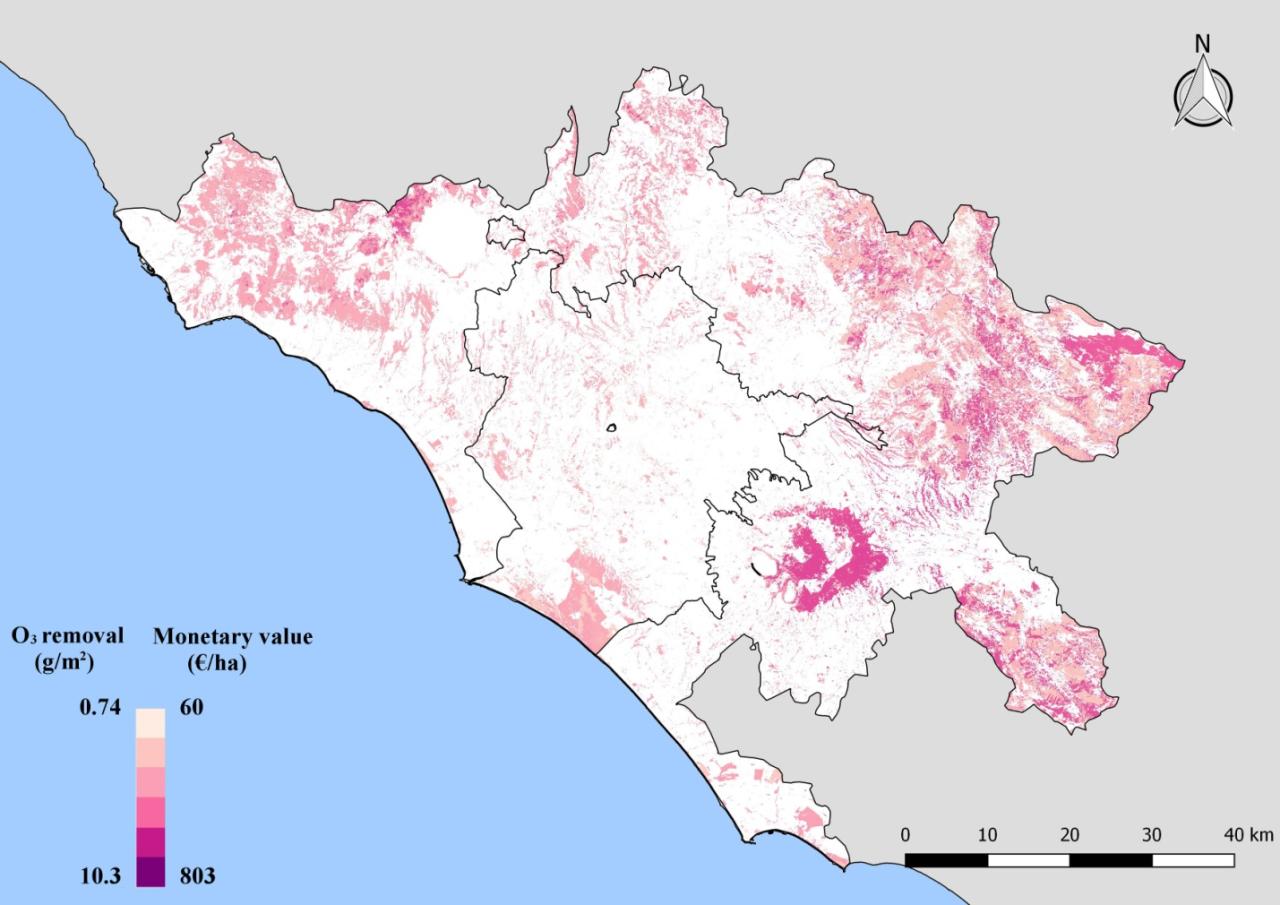
Figure 4: O3 absorption by the vegetation of the Metropolitan City of Rome (in g/m2), calculated following the methodology described in Fusaro et al. (2017) using an emission-based pollution model (AMS-MINNI, Mircea et al., 2014), and relative monetary va
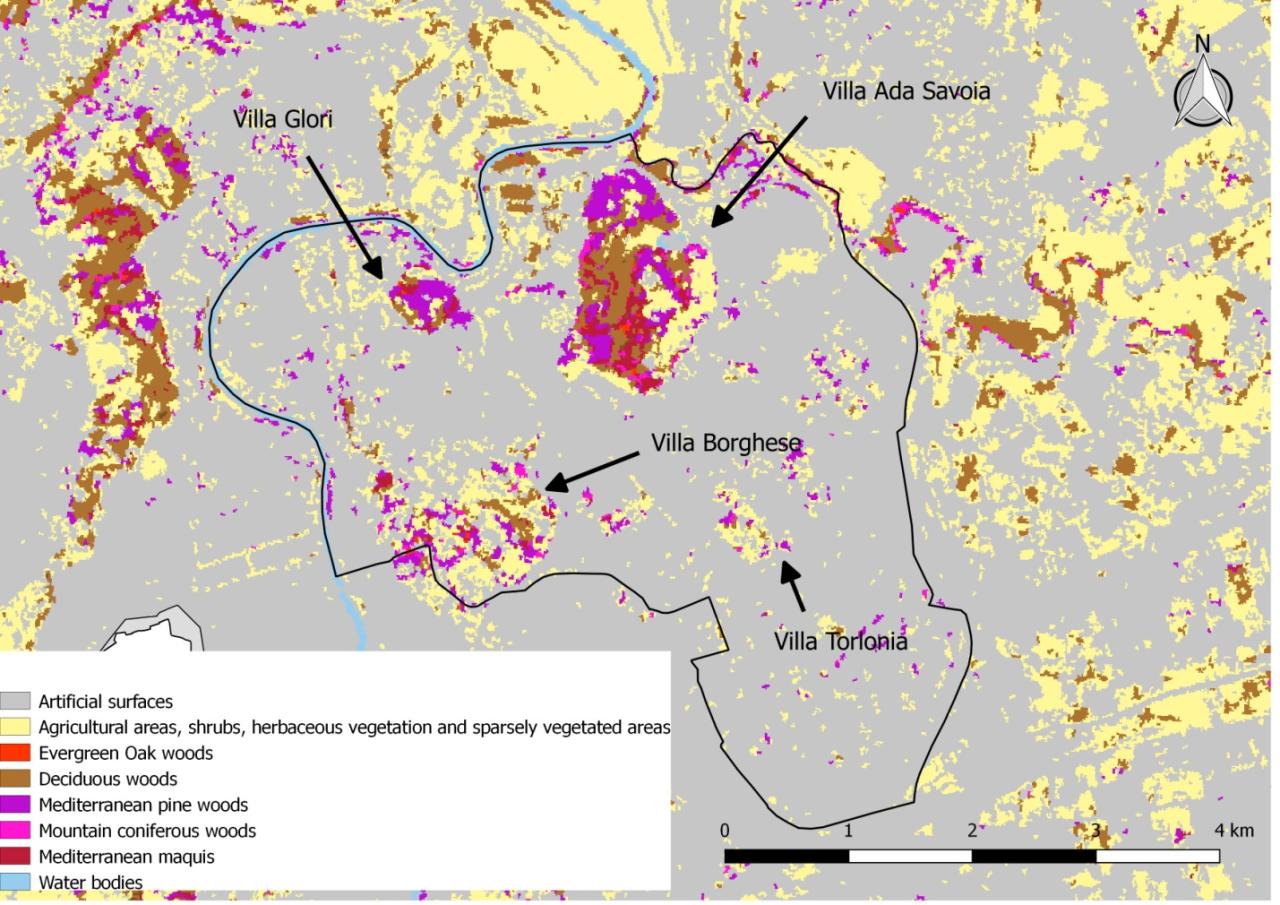
Figure 5: Classification of the land cover of the II district. Arrows indicate the location of the different historical villas present in the Municipio.
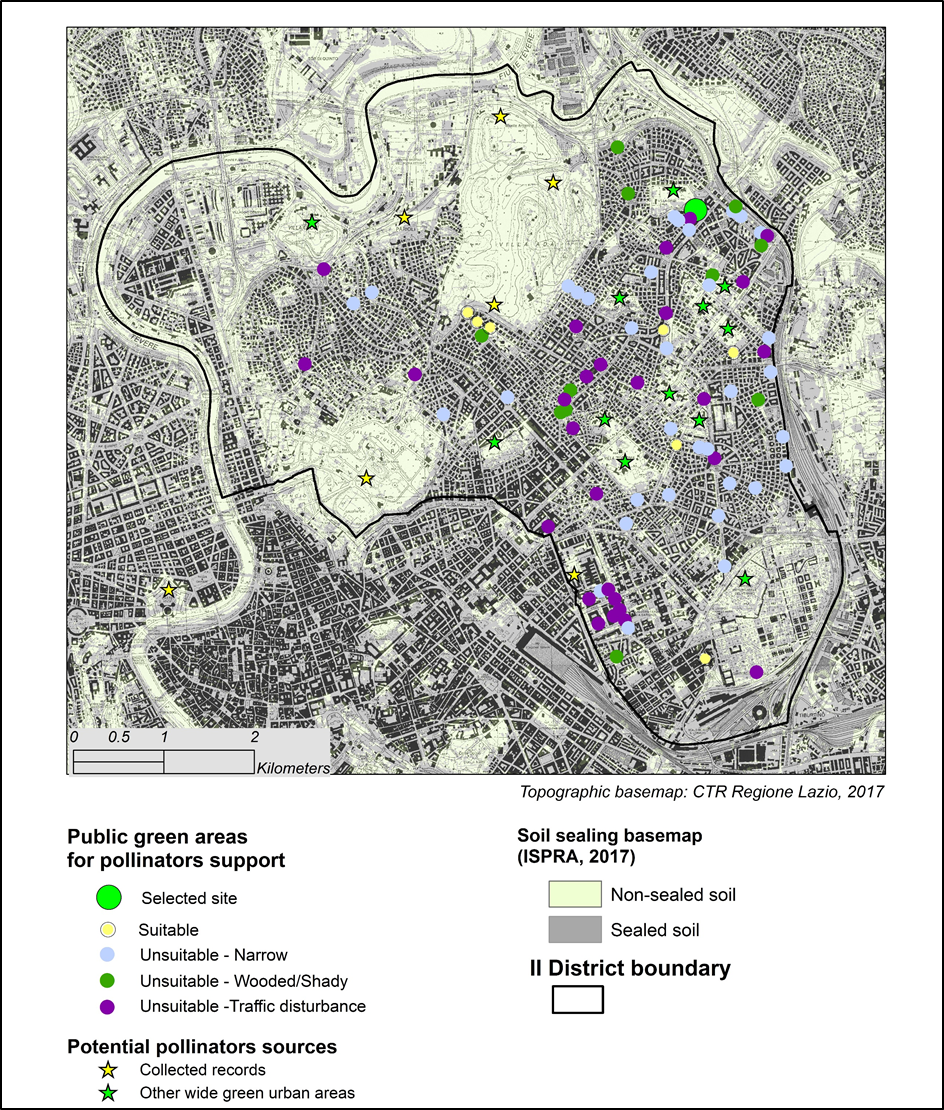
Figure 6. The map represents the spatial basic information for planning pilot projects for pollinators support in the II District of Rome.
Organisations:
Fausto Manes, Carlo Blasi, Paolo Audisio, Giulia Capotorti, Federica Marando, Alessandro Sebastiani, Elisabetta Salvatori, Lina Fusaro, Laura Zavattero, Riccardo Copiz, Eva Del Vico
Policy challenge(s)/questions:
Within the EnRoute Project, the challenge of the City Lab of Rome is to apply the urban-MAES framework on a multi-scale progression.
In particular, the following policy questions have been addressed:
- Improvement of air quality at the sub-municipality level (II District – II Municipio) according to the local demand for the service and compared to the metropolitan city context. This area is characterized by high air pollutant levels such as particulate matter and tropospheric ozone (Cattani et al., 2017; Manes & Sarigiannis, 2011), which often exceed air quality thresholds for ecosystems and human health protection. The II District hosts some important historical villas and tree-lined roads (Manes et al., 2008; Silli et al., 2015). However, there is the need for a more effective measure to enhance urban and peri-urban Green Infrastructure for a sustainable strategy to be pursued by policy makers to increase resilience and to improve air quality;
- Enhancement of the cultural services associated to pollinator conservation in the II District of Rome. In alignment with the rationale of the Charter of Rome, the challenge is to stimulate positive links between Cultural and Natural Capitals in the dense urban settlement of the II District. Specifically, the scientific team and the local administration have interfaced in considering the social and cultural dimension of ecosystem management, in promoting locally-adapted activities with positive impacts on Natural Capital, and in effectively linking benefits from ecosystems (supply) with cultural and socio-economic patterns (demand)
- Promotion of synergies between biodiversity conservation/restoration and the enhancement of ES provision capacity at multiple levels (from the District to the Metropolitan City level). With respect to the 2nd target of the EU Biodiversity Strategy, the challenge is to raise awareness on attainable win-win solutions for ecosystems and their services by means of biodiversity-led and multi-functional Green Infrastructure planning and management.
Process:
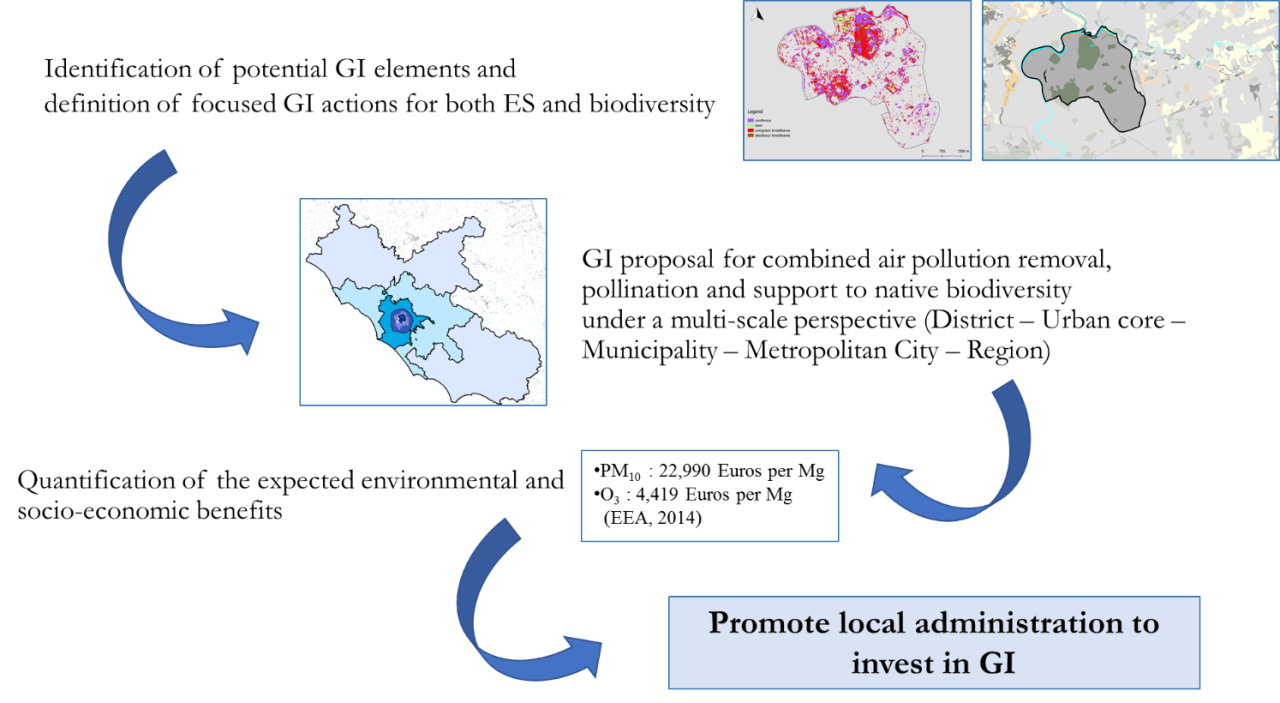
The analysis of environmental, social and political aspects of the city and the identification of priority biodiversity and ES demand (e.g. restoration of degraded, fragmented or lost ecosystems; air quality improvement due to pollutant levels exceeding air quality thresholds) represented the first project phase.
Secondly, the choice of the study area was performed by means of ecosystem mapping, characterisation of ecosystem properties and condition, and spatial analysis of relevant ES processes. A comprehensive list of suitable indicators was identified (4th report MAES), and the selection of appropriate modelling and monetary valuation for air quality was performed. Pollinators support was planned with the entomologist and floristic experts of the research team and with the II District policy makers. In order to promote synergies between biodiversity and ES and between Natural and Cultural Capital, collected knowledge on the variety, pressures and condition of local biodiversity and natural ecosystems underpinned the overall process.
Key steps are represented by the following meetings with EnRoute coordinators and JRC researchers, City Labs researchers and local administration staff:
Kick-off meeting in Rome (7-8/03/2017); Meeting in Malta (13-14/06/2017); Meeting in Ispra (07/02/2018); Webinar (23/03/2018); Meeting in Sofia (24-25/04/2018); Meeting in Rome (3-7/07/2018) for ES analysis and mapping (air quality, pollination) and Ecoregional framework of European cities; phone calls with the EnRoute coordinators.
Choices were substantially taken by researchers. The Local Administration had an essential role in recommending priority green spaces for the selected actions.
The interaction between the policymakers and the scientists resulted:
Key elements for success are mapping and monetary assessment of regulating ES to be transferred to policy makers and awareness raising in the public administration on the importance of biodiversity and ES.
Pitfalls are lack of data, budget limitations and difficulties in setting an effective SPI.
Key indicators for addressing these question(s):
|
POLICY QUESTION |
INDICATOR |
STATUS |
|
Improvement of air quality |
ES: Capacity indicator for air quality regulation (pollutants removed by vegetation in kg/ ha * year) |
Available for PM10 and O3 removal at different administrative levels (2003, 2017) |
|
PRESSURE: air pollutants concentration (µg/m3,ppm) |
Available for PM10 and O3at different administrative levels (2003, 2011, 2017) |
|
|
Cultural service of pollinator conservation |
STATE of BIODIVERSITY: occurrence and distribution of wild pollinators |
Collected from literature for the urban sector of the Municipality (within the Main Ring Road) |
|
ES demand: potential use of green spaces for nature-based education |
Available from the II District map of public green spaces |
|
|
ES Providing Units: suitable public green spaces for supporting wild bee populations |
Assessment of green space suitability originally performed for the EnRoute project (extent, current tree cover, distance from potential source populations, distance from disturbance sources) |
|
|
Biodiversity conservation and restoration |
PRESSURE: ecological impacts of urbanization trend |
Available for the Municipality of Rome Capital |
|
STATE of ECOSYSTEMS: degree of naturalness |
Available for the Metropolitan City and the Municipality |
|
|
STATE of LAND USE: Landscape conservation status |
Available for the Metropolitan City and for the Municipality according to different ecological classification of land units. Not suitable to be performed at the level of the administrative unit “Municipio II” |
|
|
URBAN BIODIVERSITY: occurrence and distribution of representative native plant species |
Available for the overall urban sector of the Municipality |
Key results:
Figure 1: Land cover classification of the Latium region from a Sentinel-2 image – year 2016 (10 m2 spatial resolution). The classification yielded 11 different land cover classes, including 7 different physiognomic-structural categories of vegetation. The area inside the outline represents the municipality of Rome (from Fusaro et al., 2017)
Figure 2: Yearly average Leaf Area Index (LAI, m2/m2) values (2016) retrieved from the MOD15A2H MODIS product for the Latium region. Higher LAI values can be found in correspondence of dense forest stands, in particular in peri-urban areas. The area inside the outline represents the municipality of Rome (from Fusaro et al., 2017)
Figure 3: seasonal PM10 removal by the vegetation of the Metropolitan City of Rome (in g/m2), calculated following the methodology described in Marando et al. (2016) using monitoring stations data for PM10, and relative monetary value (in €/ha) calculated on the basis of externality values (EEA, 2014) – Modified from Marando et al. (2016)
Figure 4: O3 absorption by the vegetation of the Metropolitan City of Rome (in g/m2), calculated following the methodology described in Fusaro et al. (2017) using an emission-based pollution model (AMS-MINNI, Mircea et al., 2014), and relative monetary value (in €/ha) calculated on the basis of externality values (EEA, 2014). Modified from Fusaro et al. (2017).
Figure 5: Classification of the land cover of the II district. Arrows indicate the location of the different historical villas present in the Municipio.
Figure 6. The map represents the spatial basic information for planning pilot projects for pollinators support in the II District of Rome.
Stars represent recorded/potential population sources for wild pollinators (from literature and land cover data, respectively). Circles represent green spaces directly managed by the II District that are classified according to their suitability/unsuitability for hosting pollinator support actions (extent of the site, present cover of trees, disturbance from vehicular traffic, distance from potential pollinator population sources). The green circle shows the selected site for the pilot project (600 sqm, maximum suitability and high provisioning potential for the expected cultural ecosystem service).
|
Family |
Species |
Indicative flowering period |
Life form |
Elevation range of natural distribution |
|||
|
|
|
Winter |
Spring |
Summer |
Fall |
|
|
|
FABACEAE |
Cercis siliquastrum L. |
|
x |
|
|
P |
0-800 |
|
ERICACEAE |
Arbutus unedo L. |
x |
|
|
x |
P |
0-900 |
|
MYRTACEAE |
Myrtus communis L. |
|
|
x |
|
P |
0-500 |
|
CAPRIFOLIACEAE |
Lonicera implexa Aiton |
|
x |
x |
|
P |
0-800 |
|
ERICACEAE |
Erica multiflora L. |
|
|
|
x |
NP/P |
0-600 |
|
LAMIACEAE |
Rosmarinus officinalis L. |
|
x |
x |
|
NP/P |
0-800 |
|
LAMIACEAE |
Lavandula angustifolia Mill. |
|
|
x |
x |
NP |
0-400 |
|
LAMIACEAE |
Lavandula stoechas L. |
x |
x |
|
|
NP |
0-400 |
|
LAMIACEAE |
Teucrium chamaedrys L. |
|
x |
x |
|
Ch |
0-1700 |
|
LAMIACEAE |
Thymus sp. pl. |
|
x |
x |
|
Ch |
0-1600 |
|
LAMIACEAE |
Satureja montana L. |
|
|
x |
x |
Ch |
100-1300 |
|
CISTACEAE
|
Helianthemum nummularium (L.) Mill. subsp. obscurum (Čelak.) Holub |
|
x |
x |
|
Ch |
200-1400 |
|
CRASSULACEAE |
Sedum sexangulare L. |
|
x |
x |
|
Ch |
50-2000 |
|
BRASSICACEAE |
Lobularia maritima (L.) Desv. |
x |
|
|
|
H/Ch |
0-300 |
|
LAMIACEAE |
Salvia verbenaca L. |
x |
x |
x |
x |
H |
0-1400 |
Figure 7. Preliminary list of species to be planted in the site for the pilot project on pollinators support in the II District of Rome. The list is compiled according to: high pollinator support capacity of the plant species and of respective genus and family; native status in the metropolitan area of Rome (autochthonous species of different ecoregions and natural habitats of the Metropolitan City); complete species biology; prevalent perennial life form (especially P/NP-Phanerophytes/Nanophanerophyte, Ch-Chamaephytes and few H-Hemicryptophytes); long-lasting individual or comprehensive flowering phenology (continuous nectar and pollen sources from winter to fall). Data sources: Anzalone et al., 2010; Capotorti et al., 2013; Celesti-Grapow et al., 2013; Pignatti, 2017; http://dryades.units.it/Roma/index.php.
Figure 8: Critical conditions for species (a and b, on the left side) and ecosystems (c and d, on the right side) in the II District of the Municipality of Rome (black outline). Basic data are derived from: Celesti-Grapow 1995; Capotorti et al., 2013, 2015, 2017; CIRBFEP, 2013).
The information is useful to prioritise both sites and actions for the deployment of a GI at the local scale (e.g. where to first plant native trees and restore natural vegetation communities; where to foster progressive replacement of no-native plant species; where to especially enhance ecological connectivity between green spaces; where to recreate open spaces).
Policy relevance:
Within the EnRoute Project, the challenge of the City Lab of Rome is to apply the urban-MAES framework on a multi-scale progression.
In particular, the following policy questions have been addressed:
- Improvement of air quality at the sub-municipality level (II District – II Municipio) according to the local demand for the service and compared to the metropolitan city context. This area is characterized by high air pollutant levels such as particulate matter and tropospheric ozone (Cattani et al., 2017; Manes & Sarigiannis, 2011), which often exceed air quality thresholds for ecosystems and human health protection. The II District hosts some important historical villas and tree-lined roads (Manes et al., 2008; Silli et al., 2015). However, there is the need for a more effective measure to enhance urban and peri-urban Green Infrastructure for a sustainable strategy to be pursued by policy makers to increase resilience and to improve air quality;
- Enhancement of the cultural services associated to pollinator conservation in the II District of Rome. In alignment with the rationale of the Charter of Rome, the challenge is to stimulate positive links between Cultural and Natural Capitals in the dense urban settlement of the II District. Specifically, the scientific team and the local administration have interfaced in considering the social and cultural dimension of ecosystem management, in promoting locally-adapted activities with positive impacts on Natural Capital, and in effectively linking benefits from ecosystems (supply) with cultural and socio-economic patterns (demand)
- Promotion of synergies between biodiversity conservation/restoration and the enhancement of ES provision capacity at multiple levels (from the District to the Metropolitan City level). With respect to the 2nd target of the EU Biodiversity Strategy, the challenge is to raise awareness on attainable win-win solutions for ecosystems and their services by means of biodiversity-led and multi-functional Green Infrastructure planning and management.
Conclusions:
The City Lab of Rome provides empirical evidence on the importance of enhancing ecosystem condition and preserving ecosystem functions for sustaining the provision of multiple ES.
It demonstrates that structural characteristics (e.g. LAI, species diversity) and functional diversity (e.g. stomatal conductance) of urban and periurban forests are key morpho-functional parameters for regulating ES estimation.
The challenges are i) to plan a GI that is able to jointly support biodiversity (benefits for the environment) and ES (benefits for citizens) and ii) to apply a multi-scale approach for addressing the different GI targets.
The opportunities are i) to integrate multiple disciplinary approaches for the implementation of Nature-Based solutions that can improve human health and well-being in urban and peri-urban areas and ii) to interface with policy makers that have concrete local responsibilities
These findings suggest the need to transfer this knowledge to society, also for a cultural growth and in accordance to SDGs UN agenda to 2030 and in particular with 3, 11, 13, and 15 objectives.
Limitations of the approach / data / models used:
To date, in the methodological approach adopted by the City Lab of Rome, a number of limitations were present. In particular, the spatialization of air pollution data was not feasible regarding O3 because too few monitoring stations on the territory are present. Therefore an emission-based modelling system (AMS-MINNI) was adopted for O3. Another limitation is the lack of methodologies/instruments to validate properly the regulating ES and to test for effectiveness of the adopted measures. Furthermore, our estimates of PM10 and O3 removal by vegetation are based on approximations of two key input parameters described in the models, in particular PM10 deposition velocity to plant canopy (Vd) and plant stomatal conductance (gs). Vd in fact depends not only on the LAI, as assumed in our methodology, but also on atmospheric conditions such as air temperature, wind speed, and relative humidity (Mohan, 2016), and is thus affected by dynamics dependent by site characteristics and time, that were not addressed in our work. Furthermore, the use of an annual average gs value for each vegetation group does not allow the estimation of site-specific time dependent trends in O3 fluxes. Therefore, the amount of O3 removed by vegetation could have been overestimated, particularly under Mediterranean conditions (Fusaro et al., 2015a, 2015b; Manes et al., 2007, 2012, 2016).
As regards pollinators support, important limitations are posed by the lack of updated and locally sampled data on occurrence and distribution of wild bees in the selected green spaces. The lack of data is expected to be overcome in the near future by expanding the early result of the Enroute City Lab. In this regard, an interdisciplinary research has been designed for applying the ESTIMAP modelling to the wider metropolitan area of Rome in keeping with the prescriptive rules of the Land Ecological Network (Blasi et al., 2008).
As regards the promotion of native species and natural ecosystems in the framework of GI planning, main limitations are posed by: poor investments on basic knowledge (faunistic, floristic and vegetation sampling); lack of fine assessments of ecosystem conditions in terms of structure and composition; lack of local scale evidences on the relationships between ecosystem conditions and ES capacity; weak expertise on potential disservices within the interdisciplinary team.
Publications and reports:
Anzalone B, Iberite M, Lattanzi E. 2010. La Flora vascolare del Lazio. Informatore Botanico Italiano 42:187-317.
Blasi, C., Zavattero, L., Marignani, M., Smiraglia, D., Copiz, R., Rosati, L., Del Vico, E., 2008. The concept of land ecological network and its design using a land unit approach. Plant Biosystems 142, 540–549.
Capotorti G., Del Vico E., Anzellotti I., Celesti-Grapow L., 2017. Combining the conservation of biodiversity with the provision of ecosystem services in urban green infrastructure planning: critical features arising from a case study in the metropolitan area of Rome, Sustainability, 9(1), 10.
Capotorti G., Del Vico E., Lattanzi E., Tilia A., Celesti-Grapow L., 2013 Exploring biodiversity in a metropolitan area in the Mediterranean region: The urban and suburban flora of Rome (Italy). Plant Biosystems, 147(1): 174-185.
Capotorti G., Mollo B., Zavattero L., Anzellotti I., Celesti-Grapow L., 2015 Setting Priorities for Urban Forest Planning. A Comprehensive Response to Ecological and Social Needs for the Metropolitan Area of Rome (Italy). Sustainability, 7: 3958-3976.
Celesti Grapow L. 1995. Atlas of the flora of Rome [Atlante della flora di Roma. La distribuzione delle piante spontanee come indicatore ambientale. In Italian with English summary]. Rome, Italy: Comune di Roma. pp. 222.
Celesti-Grapow, L., Capotorti, G., Del Vico, E., Lattanzi, E., Tilia, A., Blasi, C., 2013. The vascular flora of Rome. Plant Biosystems 147, 1059–1087.
CIRBFEP (Centro di Ricerca Interuniversitario Biodiversità, Fitosociologia ed Ecologia del Paesaggio), 2013. Serie di vegetazione e vegetazione naturale potenziale della Provincia di Roma. (Vegetation series and potential natural vegetation of the Province of Rome). (In Italian). Available at: http://websit.cittametropolitanaroma.gov.it/BDV2014/Veget_Reale.aspx
European Environment Agency (EEA). Costs of Air Pollution from European Industrial Facilities 2008–2012—An Updated Assessment; EEA Technical report No 20/2014; European Environment Agency: Copenhagen, Denmark, 2014.
Fusaro, L., Salvatori, E., Mereu, S., Marando, F., Scassellati, E., Abbate, G., & Manes, F., 2015 a. Urban and peri-urban forests in the metropolitan area of Rome: Ecophysiological response of Quercus ilex L. in two green infrastructures in an ecosystem services perspective. Urban Forestry & Urban Greening, 14(4), 1147-1156.
Fusaro, L., Salvatori, E., Mereu, S., Silli, V., Bernardini, A., Tinelli, A., & Manes, F., 2015 b. Researches in Castelporziano test site: ecophysiological studies on Mediterranean vegetation in a changing environment. Rendiconti Lincei, 26(3), 473-481.
Maes, J., Zulian, G., Thijssen, M., Castell, C., Baró, F., Ferreira, A. M., et al. (2016). Mapping and Assessment of Ecosystems and their Services. Urban Ecosystems. Luxembourg: Publications Office of the European Union
Manes, F., Vitale, M., Fabi, A. M., De Santis, F., & Zona, D. (2007). Estimates of potential ozone stomatal uptake in mature trees of Quercus ilex in a Mediterranean climate. Environmental and Experimental Botany, 59(2), 235-241.
Manes, F., Salvatori, E., La Torre, G., Villari, P., Vitale, M., Biscontini, D., & Incerti, G. (2012). Urban green and its relation with air pollution: ecological studies in the Metropolitan area of Rome. Italian Journal of Public Health, 5(4).
Manes, F., Sarigiannis, D., 2011. Health Risk from Environmental Pollution Level in Urban Systems (HEREPLUS). Operational manual, base on the assessment of risk maps. Editrice Sapienza, Rome.
Manes, F., Incerti, G., Salvatori, E., Vitale, M., Ricotta, C., & Costanza, R. (2012). Urban ecosystem services: tree diversity and stability of tropospheric ozone removal. Ecological applications, 22(1), 349-360.
Manes, F., Marando, F., Capotorti, G., Blasi, C., Salvatori, E., Fusaro, L., ... & Munafò, M. (2016). Regulating Ecosystem Services of forests in ten Italian Metropolitan Cities: Air quality improvement by PM 10 and O 3 removal. Ecological Indicators, 67, 425-440.
Marando, F., Salvatori, E., Fusaro, L., & Manes, F. (2016). Removal of PM10 by Forests as a Nature-Based Solution for Air Quality Improvement in the Metropolitan City of Rome. Forests, 7(7), 150.
MATTM (Ministero dell’Ambiente e della Tutela del Territorio e del Mare) (2018). Strategia Nazionale del Verde Urbano. Edited by the Italian Public Green Development Committee. Avilable at: http://www.minambiente.it/sites/default/files/archivio/allegati/comitato%20verde%20pubblico/strategia_verde_urbano.pdf
Mircea, M., Ciancarella, L., Briganti, G., Calori, G., Cappelletti, A., Cionni, I., et al., 2014. Assessment of the AMS-MINNI system capabilities to predict air quality over Italy for the calendar year 2005. Atmos. Environ., 84, pp. 178-188
Mohan S.M.., 2016. An overview of particulate dry deposition: measuring methods, deposition velocity and controlling factors. Int. J. Environ. Sci. Technol., 13, pp. 387-402
Pignatti, 2017. Flora d’Italia. Edagricole-New Business Media, Milano (IT)
Silli, V., Salvatori, E., & Manes, F. (2015). Removal of airborne particulate matter by vegetation in an urban park in the city of Rome (Italy): an ecosystem services perspective. Annali di botanica, 5, 53-62.
- Further scientific literature
Alessio, M., Anselmi, S., Conforto, L., Improta, S., Manes, F., & Manfra, L. (2002). Radiocarbon as a biomarker of urban pollution in leaves of evergreen species sampled in Rome and in rural areas (Lazio—Central Italy). Atmospheric Environment, 36(34), 5405-5416.
Allegrini, A., Anselmi, S., Cavalli, R. M., Manes, F., & Pignatti, S. (2006). Multiscale integration of satellite, airborne and field data for Mediterranean vegetation studies in the natural area of the Castelporziano Estate (Rome). Annals of Geophysics, 49(1).
Blasi, C., Capotorti, G., Marchese, M., Marta, M., Bologna, M.A., Bombi, P., Bonaiuto, M., Bonnes, M., Carrus, G., Cifelli, F., Cignini, B., Dierna, S., Esposito, G., Funiciello, R., Giannarini, I., Gratani, L., Grillotti Di Giacomo, M.G., Manes, F., Orlandi, F., Zapparoli, M., Scarascia Mugnozza, G. T., 2008. Interdisciplinary research for the proposal of the Urban Biosphere Reserve of Rome Municipality. Plant Biosystems 142, 305–312.
Blasi, C., Capotorti, G., Ortí, M. M. A., Anzellotti, I., Attorre, F., Azzella, M. M., ... & Marando, F. (2017). Ecosystem mapping for the implementation of the European Biodiversity Strategy at the national level: The case of Italy. Environmental Science & Policy, 78, 173-184.
Calfapietra, C., Fares, S., Manes, F., Morani, A., Sgrigna, G., & Loreto, F. (2013). Role of Biogenic Volatile Organic Compounds (BVOC) emitted by urban trees on ozone concentration in cities: A review. Environmental pollution, 183, 71-80.
Fares, S., Matteucci, G., Mugnozza, G. S., Morani, A., Calfapietra, C., Salvatori, E., ... & Loreto, F. (2013). Testing of models of stomatal ozone fluxes with field measurements in a mixed Mediterranean forest. Atmospheric environment, 67, 242-251.
Fusaro, L., Mereu, S., Salvatori, E., Agliari, E., Fares, S., & Manes, F. (2018). Modeling ozone uptake by urban and peri-urban forest: a case study in the Metropolitan City of Rome. Environmental Science and Pollution Research, 25(9), 8190-8205.
Gerosa, G., Vitale, M., Finco, A., Manes, F., Denti, A. B., & Cieslik, S. (2005). Ozone uptake by an evergreen Mediterranean Forest (Quercus ilex) in Italy. Part I: Micrometeorological flux measurements and flux partitioning. Atmospheric Environment, 39(18), 3255-3266.
Gerosa, G., Fusaro, L., Monga, R., Finco, A., Fares, S., Manes, F., & Marzuoli, R. (2015). A flux-based assessment of above and below ground biomass of Holm oak (Quercus ilex L.) seedlings after one season of exposure to high ozone concentrations. Atmospheric Environment, 113, 41-49.
ISPRA, 2016. Qualità dell’ambiente urbano, XII rapporto.
ISPRA, 2017. Carta nazionale del consumo di suolo ad altissima risoluzione (risoluzione 5 m). Available at: http://www.sinanet.isprambiente.it/it/sia-ispra/download-mais/consumo-di-suolo/IMP_5m.zip/view
Manes, F., Ricotta, C., Salvatori, E., Bajocco, S., & Blasi, C. (2010). A multiscale analysis of canopy structure in Fagus sylvatica L. and Quercus cerris L. old‐growth forests in the Cilento and Vallo di Diano National Park. Plant Biosystems, 144(1), 202-210.
Manes, F., Blasi, C., Salvatori, E., Capotorti, G., Galante, G., Feoli, E., & Incerti, G. (2012). Natural vegetation and ecosystem services related to air quality improvement: tropospheric ozone removal by evergreen and deciduous forests in Latium (Italy). Annali di Botanica, 2, 79-86.
Manes, F., & Salvatori, E. (2014). Ecosystem Services of urban trees: the case of Rome. Agrochimica, 58(3), 222-233.
Manes, F., Silli, V., Salvatori, E., Incerti, G., Galante, G., Fusaro, L., & Perrino, C. (2014). Urban Ecosystem Services: tree diversity and stability of PM10 removal in the Metropolitan Area of Rome. Annali di Botanica, 4, 19-26.
Salvatori, E., Fusaro, L., Strasser, R. J., Bussotti, F., & Manes, F. (2015). Effects of acute O3 stress on PSII and PSI photochemistry of sensitive and resistant snap bean genotypes (Phaseolus vulgaris L.), probed by prompt chlorophyll “a” fluorescence and 820 nm modulated reflectance. Plant Physiology and Biochemistry, 97, 368-377.
Van der Zande, D., Mereu, S., Nadezhdina, N., Cermak, J., Muys, B., Coppin, P., & Manes, F. (2009). 3D upscaling of transpiration from leaf to tree using ground-based LiDAR: Application on a Mediterranean Holm oak (Quercus ilex L.) tree. Agricultural and Forest Meteorology, 149(10), 1573-1583.
Zscheppang, A., Manes, F., La Torre, G., Boccia, A., Trueman, S., Sarigiannis, D., ... & Rigby, M. (2012). Methodology for measuring environmental health within Europe. health risk from environmental pollution levels in urban systems (HEREPLUS). Italian Journal of Public Health, 5(4).
- Published studies related to the EnRoute Project
Capotorti, G., Ortí, M. M. A., Copiz, R., Fusaro, L., Mollo, B., Salvatori, E., & Zavattero, L. (2017). Biodiversity and ecosystem services in urban green infrastructure planning: A case study from the metropolitan area of Rome (Italy). Urban Forestry & Urban Greening.
Fusaro, L., Marando, F., Sebastiani, A., Capotorti, G., Blasi, C., Copiz, R., ... & Manes, F. (2017). Mapping and Assessment of PM10 and O3 Removal by Woody Vegetation at Urban and Regional Level. Remote Sensing, 9(8), 791.
12. Further information
- About the case study and your publications and reports and websites
https://commons.wikimedia.org/wiki/File:Roma-vista10.jpg