

Images
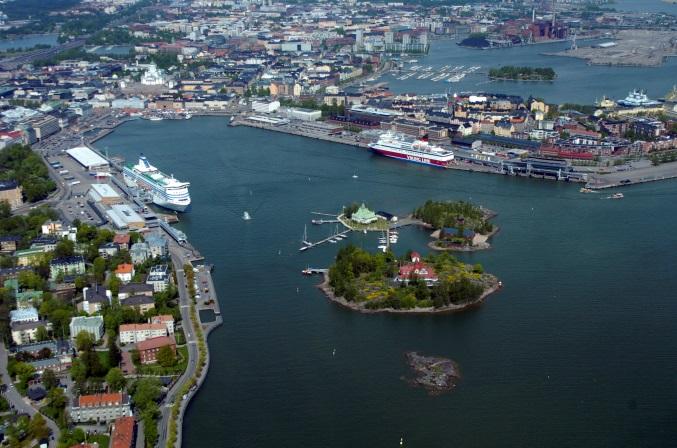
The City centre of Helsinki (Photo: Riku Lumiaro).
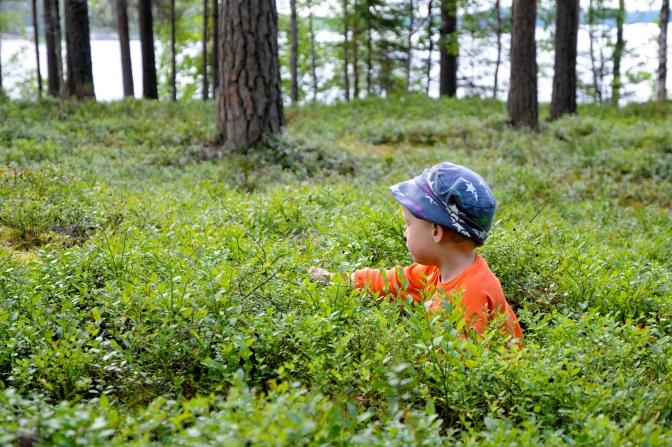
Picking billberries in a forest in Helsinki (Photo: Mikko Kuusinen)
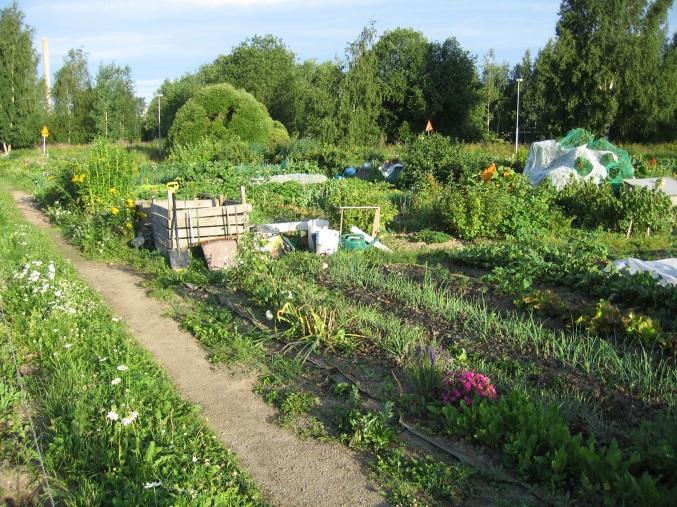
Public allotment garden in Savela (Photo: Pirjo Ferin)
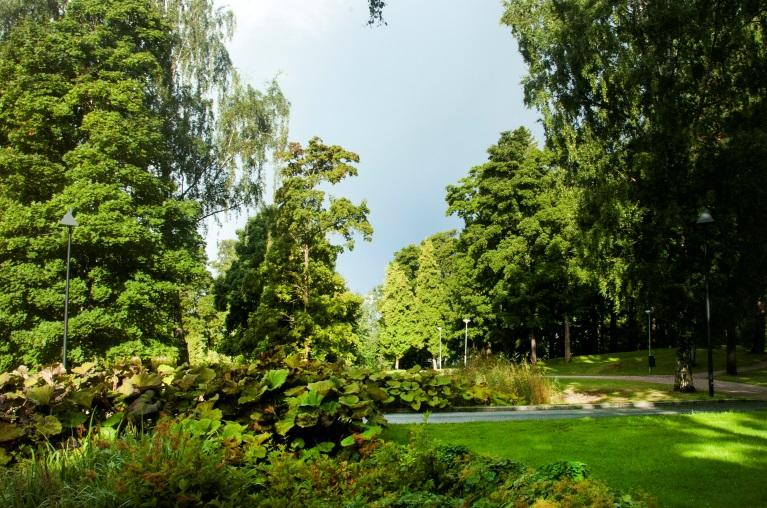
Public park in Meilahti (Photo: Riku Lumiaro). Source of all photos: Finnish Environmental Administration’s Image bank
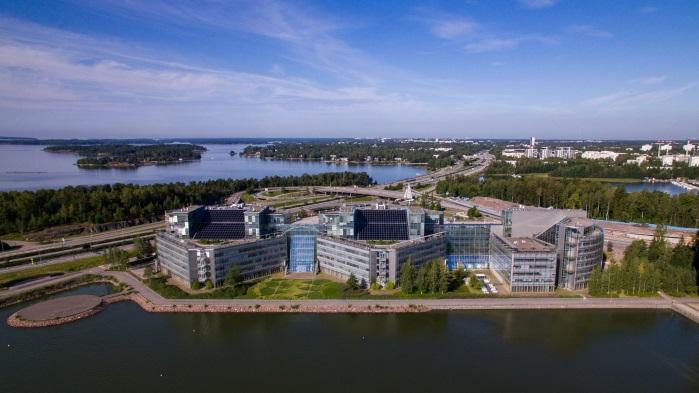
Keilaniemi (Photo: Patrik Fagerström, Source: City of Espoo).
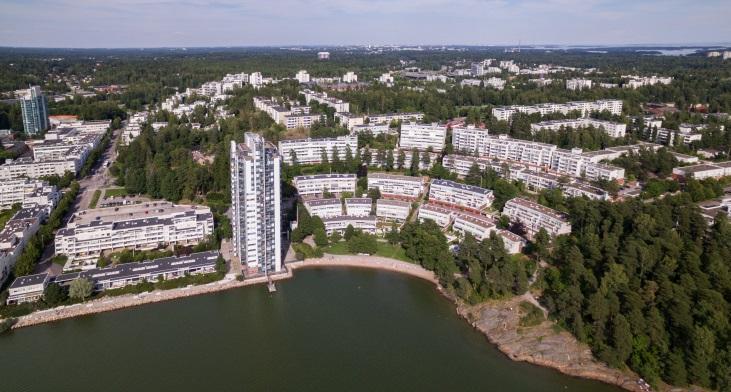
Kivenlahti (Photo: Patrik Fagerström, Source: City of Espoo).
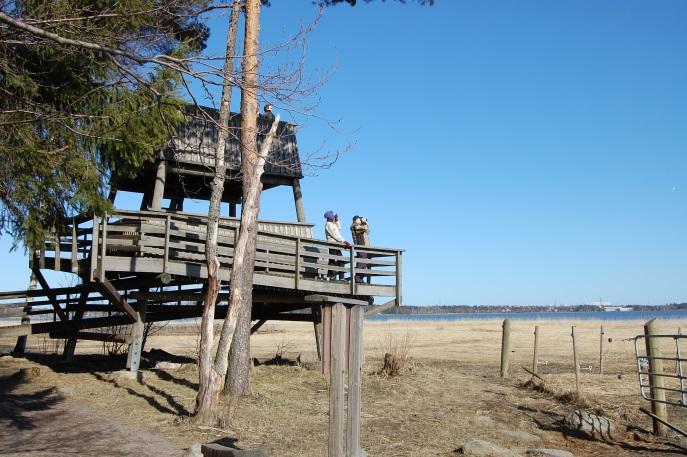
Laajalahti (Photo: Miika Heikkonen, Source: Finnish Environmental Administration’s Image bank).
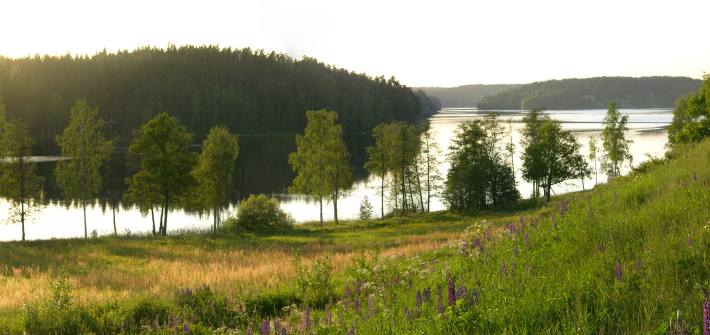
Lake Pitkäjärvi in Nuuksio (Photo: Jouko Lehmuskallio, Source: Finnish Environmental Administration’s Image bank).
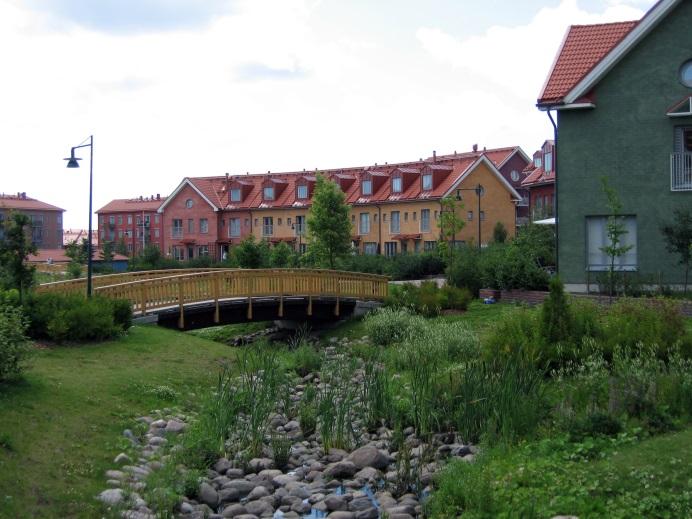
Kartanonkoski (Photo: Pirjo Ferin). Upper right: Ring Road 3 in Kuninkaala (Photo: Raili Malinen).
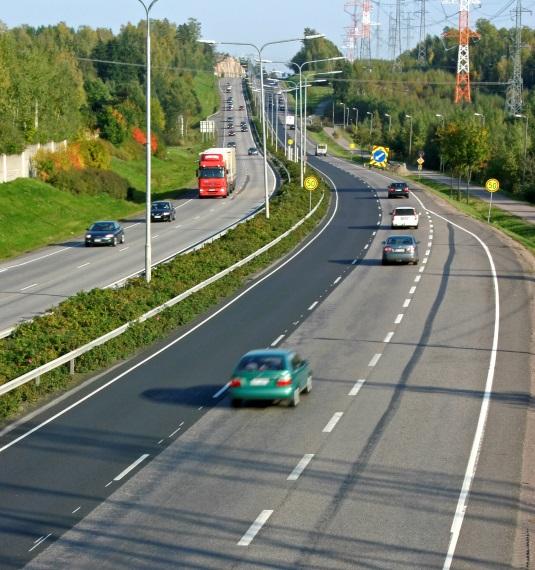
Ring Road 3 in Kuninkaala (Photo: Raili Malinen).
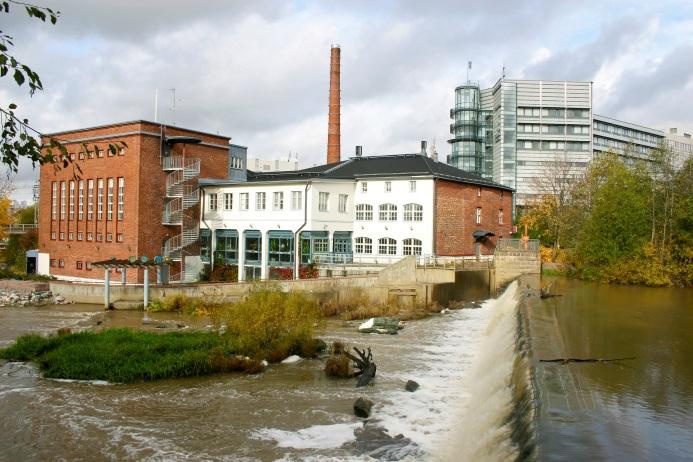
River Keravanjoki in Tikkurila, the main centre of Vantaa (Photo: Raili Malinen).
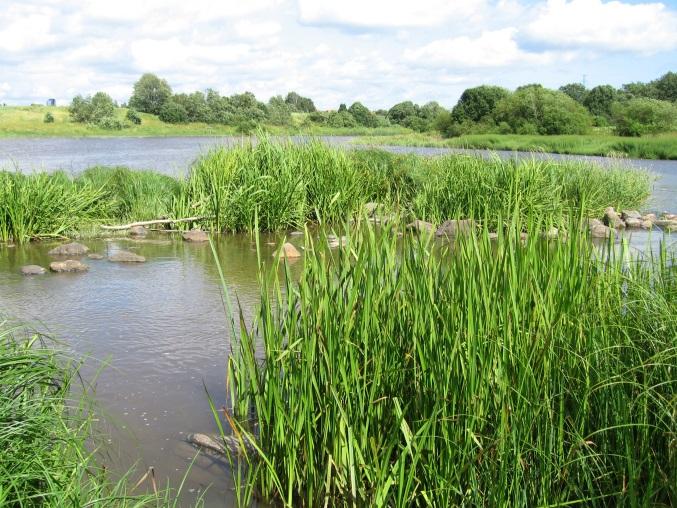
Ruutinkoski rapids in River Vantaanjoki (Photo: Pirjo Ferin). Source: Finnish Environmental Administration’s Image bank.
Organisations:
Following people contributed to the work of the Helsinki, Espoo and Vantaa city lab:
Finnish Environment Institute SYKE: Leena Kopperoinen, Arto Viinikka and Jorge Mellado
City of Helsinki: Kaisa Pajanen, Raisa Kiljunen-Siirola, Kaarina Heikkonen, Annika Harlio, Maria Jaakkola, Anna Böhling
City of Espoo: Tanja Hämäläinen, Tia Lähteenmäki, Paula Kuusisto-Hjort, Heidi Ahlgren, Tarja Söderman, Ritva Helminen
City of Vantaa: Paula Kankkunen, Laura Muukka, Sinikka Rantalainen, Sanna Ervasti, Anne Mäkynen
Acknowledgements
We gratefully acknowledge the researchers Mikko Kuussaari, Janne Heliölä, Juha Pöyry and Marjaana Toivonen from the Finnish Environment Institute. They provided their valuable expertise on pollinators for scoring different land cover and land use types based on their suitability for foraging for the most important natural pollinators in the Helsinki Metropolitan Area. They also assessed the resulting maps whether they seem to be credible.
Policy challenge(s)/questions:
The Helsinki Metropolitan Area consists of the cities of Helsinki, Espoo, Vantaa and Kauniainen and it is located in the south coast of Finland. The Metropolitan Area covers 772 square kilometres and contains a total population of approximately 1.1 million. With about 19 per cent of the country’s population in just 0.2 per cent of its surface area, the housing density of the area is high by Finnish standards. Despite the intensity of land use, the area also has large recreational areas and green spaces.
Our EnRoute city lab covers the cities of Helsinki, Espoo and Vantaa. The tiny city of Kauniainen, which is located like an island in the middle of Espoo, did not officially participate in the Finnish city lab. However, it was included in the spatial analysis because the datasets we used extend over the whole area. In this report we refer to our city lab with an acronym of HEV.
Helsinki hosts the majority of population in HEV. The vision of future Helsinki is more densely populated in all areas than it is today. In 2014, the proportion of green areas in Helsinki was still relatively high (47 % of the area) compared to other European capitals.
Espoo is the second largest city in Finland. Because Espoo is the fastest growing city in Finland, ensuring ecological connectivity is one of the challenges linked to the high annual population growth and ongoing new construction. The construction is concentrated in the southern parts of Espoo while there is a national park and many outdoor recreation areas in the forested northern areas.
City of Vantaa is the fourth largest city in Finland. The largest airport of Finland is located in Vantaa. River Vantaanjoki and its tributary River Keravanjoki as well as several highways divide the city. City of Vantaa has acted as a forerunner in Finland using nature-based solutions e.g. in stormwater management. The city aims for prevention of urban floods, developing River Vantaanjoki for migrant fish, and increasing possibilities for recreational outdoor activities at riversides.
Main policy question in the cities of Helsinki, Espoo and Vantaa is how to accommodate to the constantly growing population and the consequential continuous need for construction in a sustainable way. The current urban development policy in HEV area is to avoid urban sprawl and place new construction inside the dense urban structure. This infill development often takes place in green space and thus the challenge is how to place it in a way that does not critically harm biodiversity, the condition of ecosystems, ecosystem functioning and provision of ecosystem services. All HEV cities have mapped the green area network and ecological connections by themselves. In addition, ecosystem services have been assessed at least to some extent in each city. Recreational opportunities provided by nature are the most familiar ecosystem services to the environmental experts and city planners of HEV. There is no previous knowledge on pollination, however, and therefore it was selected as the main service to be mapped in the EnRoute project. The question was whether pollination maps can be used to prioritize urban green areas and to safeguard the most important ones from the point of view of biodiversity and pollination service provision. Alongside with this a number of other ecosystem service indicators selected by the city lab as the most interesting ones were mapped as the Finnish Environment Institute’s own activity. The city representatives were interested in comparing how the situation differs from city to city according to these indicators.
Process:
The HEV city lab consisted of civil servants from the three participating cities and researchers from the Finnish Environment Institute SYKE. City representatives came from both the cities’ planning departments as well as from the environmental centres to feed a fruitful discussion.
The city lab met thrice. The first meeting was used for going through all the Urban MAES indicators in detail and identifying existing datasets supporting the mapping of the indicators. SYKE’s researchers had prepared for the meeting by identifying all relevant nationwide datasets available in the state-level environmental administration. A lot of questions arose during the meeting regarding the actual content of different indicators, quality, spatial extent and comparability of optional local datasets and relevance of information produced by the indicator. The first long-list of indicators was selected. City representatives had a task to find out more about their possibility in providing needed data in between the first two meetings.
During the second meeting the city lab checked the available data for implementing pre-selected indicators and finally selected the ones to be mapped. There was a long discussion on what is new knowledge for the cities and thus the most interesting indicators for them. Pollination was never mapped in the HEV cities before. As the resources for the work were limited it was agreed that pollination would be the one indicator on which SYKE focused applying a couple of different mapping methods (Zulian et al. 2013, Stange et al. 2017, Schulp et al. 2014). In addition, SYKE produced a number of other “easier” Urban MAES indicator maps as its own activity.
The third meeting was arranged after the spatial analyses had been carried out and the maps were available. They were examined together benefiting from the precise local knowledge of the city representatives.
The choices in the process were made collaboratively giving plenty of time for open discussion. The interaction succeeds well when all parties respect each other’s expertise and are willing to listen and learn from each other. The HEV city lab was a very good team and it wishes to continue the collaboration even after the project’s end.
Key indicators for addressing these question(s):
Suitability of existing green areas to support pollinators was selected as the main indicator to be mapped in the EnRoute project.
In addition, as SYKE’s self-funded activity a number of other indicators seen important by the HEV city lab were mapped:
- Built-up area of all land area (%)
- Land taken for construction (new built-up areas) between 2006 -2012
- Impervious and pervious land cover (%)
- Accessibility to green areas from kindergartens (as an indicator of urban cultural ecosystem service)
- Land areas suitable for nature-based recreation
- Accessibility to close-to-home recreation areas
Key results:
Map of the indicator Suitability of existing green areas to support pollinators is presented in Figure 1.
Figure 1. Suitability of the land types for pollinators, i.e. pollination potential map of the Helsinki Metropolitan Area.
The pollination potential map reflects naturally the most suitable nesting and foraging places for the most important wild pollinators, especially bumble bees. Such areas include, for example, forest edges, meadows, flowering gardens and green strips, and park areas with trees and bushes. Although water side as such does not increase the suitability for pollinators, there are many places along the water’s edge where the habitat types seem to favour pollinators. Generally areas with little management (almost wasteland) on one hand and carefully managed areas such as cemeteries and public gardens with intense management on the other hand can be detected as hot spots.
Compared with the HEV cities’ coarse scale green area maps (Figures 2, 3 and 4), areas supporting pollinators seem to coincide mainly well with established green areas. On finer scale the situation might look different.
Figure 2. Green area network of the city of Vantaa. The Helsinki-Vantaa airport divides the city in eastern and western parts and forms a considerable barrier to species movement in addition to several highways crossing the city. Ecological networks have mainly broken as a consequence of densifying urban structure. (Source: City of Vantaa)
Figure 3. Identified bottlenecks of Espoo’s ecological network in which the connections are damaged or about to be broken and where planning of projects or spatial plans should not further deteriorate the connections. (Source: City of Espoo)
Figure 4. Targeted green and recreational network of the city of Helsinki, including the lay-out of green areas hierarchy, complements of the green network, defined district parks, green corridors, connections, and water transit hubs and lines. (Source: City of Helsinki)
An example of other implemented Urban MAES indicators is the number of kindergartens locating within or further away than 300 meters from the nearest forest (Figure 5).
Figure 5. An indicator of urban cultural ecosystem services: accessibility to green areas (here forests) from kindergartens.
Figure 6. Percentage of green areas within 300 m from kindergartens.
Policy relevance:
The Helsinki Metropolitan Area consists of the cities of Helsinki, Espoo, Vantaa and Kauniainen and it is located in the south coast of Finland. The Metropolitan Area covers 772 square kilometres and contains a total population of approximately 1.1 million. With about 19 per cent of the country’s population in just 0.2 per cent of its surface area, the housing density of the area is high by Finnish standards. Despite the intensity of land use, the area also has large recreational areas and green spaces.
Our EnRoute city lab covers the cities of Helsinki, Espoo and Vantaa. The tiny city of Kauniainen, which is located like an island in the middle of Espoo, did not officially participate in the Finnish city lab. However, it was included in the spatial analysis because the datasets we used extend over the whole area. In this report we refer to our city lab with an acronym of HEV.
Helsinki hosts the majority of population in HEV. The vision of future Helsinki is more densely populated in all areas than it is today. In 2014, the proportion of green areas in Helsinki was still relatively high (47 % of the area) compared to other European capitals.
Espoo is the second largest city in Finland. Because Espoo is the fastest growing city in Finland, ensuring ecological connectivity is one of the challenges linked to the high annual population growth and ongoing new construction. The construction is concentrated in the southern parts of Espoo while there is a national park and many outdoor recreation areas in the forested northern areas.
City of Vantaa is the fourth largest city in Finland. The largest airport of Finland is located in Vantaa. River Vantaanjoki and its tributary River Keravanjoki as well as several highways divide the city. City of Vantaa has acted as a forerunner in Finland using nature-based solutions e.g. in stormwater management. The city aims for prevention of urban floods, developing River Vantaanjoki for migrant fish, and increasing possibilities for recreational outdoor activities at riversides.
Main policy question in the cities of Helsinki, Espoo and Vantaa is how to accommodate to the constantly growing population and the consequential continuous need for construction in a sustainable way. The current urban development policy in HEV area is to avoid urban sprawl and place new construction inside the dense urban structure. This infill development often takes place in green space and thus the challenge is how to place it in a way that does not critically harm biodiversity, the condition of ecosystems, ecosystem functioning and provision of ecosystem services. All HEV cities have mapped the green area network and ecological connections by themselves. In addition, ecosystem services have been assessed at least to some extent in each city. Recreational opportunities provided by nature are the most familiar ecosystem services to the environmental experts and city planners of HEV. There is no previous knowledge on pollination, however, and therefore it was selected as the main service to be mapped in the EnRoute project. The question was whether pollination maps can be used to prioritize urban green areas and to safeguard the most important ones from the point of view of biodiversity and pollination service provision. Alongside with this a number of other ecosystem service indicators selected by the city lab as the most interesting ones were mapped as the Finnish Environment Institute’s own activity. The city representatives were interested in comparing how the situation differs from city to city according to these indicators.
Conclusions:
Pollinator habitat suitability maps should be coupled with actual field data on pollinators for ground truthing. Even that it is already commonly known that the global food supply may be threatened by pollinator loss, there are no resources for pollinator monitoring. In HEV cities, pollinator data is purely dependent on scattered studies by Master’s students of the University of Helsinki. In the face of continuously diminishing public resources new ways to accomplish monitoring should be considered.
Different wild pollinator species have different foraging habits and nesting preferences. Based on local studies from the HEV cities, land cover change does not affect much the number of pollinators but it is seen in the prevalence of different pollinator species. This is a significant finding in terms of understanding which plants are threatened by the decreasing number of pollinators specialised in them. In monitoring activity, it is thus recommended to examine not only the number but also the composition of wild pollinators because along with the land use change the species combination can change a lot. An important challenge is to understand how urbanisation and densifying urban structure affects pollination potential of areas.
Relationship between wild pollinators and domestic bees needs further investigation. We do not know precisely and in the long-run what is the effect of beehives in the city.
Pollinators are an important part of biodiversity and offer plenty of ecosystem services, including education and aesthetics. Cities can gain in many ways by producing land type suitability maps for wild pollinators. The more precise data exists, the better the usability of the maps.
Limitations of the approach / data / models used:
There are limitations of the model related to data. Local data derived from several cities is not always uniform in terms of content, spatial scale, quality etc., which limits the usability of such data. In addition, lots of data that would improve the model does not even exist because of its fine scale or variability of the phenomenon in time. Such is, for example, the locational data of flowering plants favoured by wild pollinators.
Models do not necessarily produce maps that reflect the reality in space. Therefore the produced maps should be validated by fieldwork, i.e. in case of pollination wild pollinators should be monitored in the field. In HEV cities there is no extensive data of wild pollinators, only some separate scattered studies.
Pollination was mapped using an ESTIMAP approach which had been applied in a number of other cities, including another Nordic city, Oslo, Norway. In addition, we tested the feasibility of the pollination mapping approach of Schulp et al. (2014) applied in Malta to get comparative results to ESTIMAP. It was not possible to implement the model in full because of missing data of, for example, existing bee gardens. The resulting maps were much coarser than the ones derived by ESTIMAP model.
Publications and reports:
Schulp, C.J.E., Lautenbach, S., Verburg, P.H. 2014. Quantifying and mapping ecosystem services: Demand and supply of pollination in the European Union. Ecological Indicators 36: 131-141. http://dx.doi.org/10.1016/j.ecolind.2013.07.014
Stange, E.E., Zulian, G., Rusch, G.M., Barton, D.N., Nowell, M. 2017. Ecosystem services mapping for municipal policy: ESTIMAP and zoning for urban beekeeping. One Ecosystem 2: e14014. http://dx.doi.org/10.3897/oneeco.2.e14014
Zulian G., Maes J., Paracchini M. 2013. Linking Land Cover Data and Crop Yields for Mapping and Assessment of Pollination Services in Europe. Land 2 (3): 472‑492. URL: http://www.mdpi.com/2073-445X/2/3/472